a UNESCAP Intergovermental Organization
a UNESCAP Intergovermental Organization
Monthly Publication
MARKET REVIEW - August 2020
PRICE HISTORY
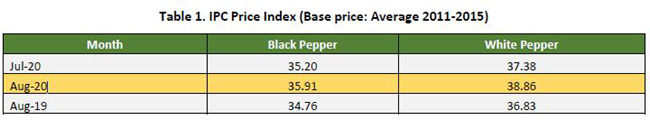
August 2020 saw the price index with a positive outlook. The price index of black pepper was reported at 35.91 points, recording an increase of 2% as compared to the previous month and 3% increase as compared with the same month in 2019. Similarly, price index of white pepper for the 8th month of 2020 was reported with an increase by 4% as compared with July 2020 at 38.86 points (Table 1). A higher percentage of increase by 6% was reported when compared with the same month in 2019.
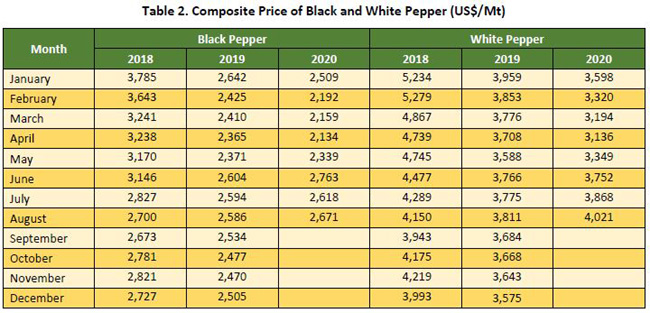
Composite prices for August 2020 were reported positive as composite price of black pepper recording an increase of USD 53 per Mt as compared with the previous month and was reported at USD 2,671 per MT. Recording a higher margin of increase than composite price of black pepper, composite price of white pepper was reported with USD 154 per Mt increase as compared with the previous month and was reported at USD 4,021 per Mt (Table 2).
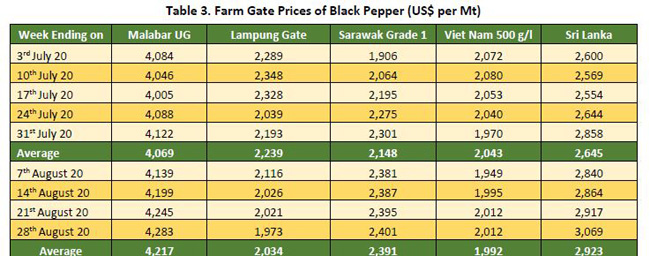
Pepper prices in the 8th month of 2020, showed a mixed response. The farm gate price of black pepper in India was reported with an increase of 4% as opposed to July, averaging at USD 4,217 per Mt (Table 3). In the local currency farm gate price of India black pepper was reported at an average of INR 315 per Kg, increasing from INR 304 per Kg in the previous month.
The price of black pepper in Indonesia (Lampung black pepper) was reported with a decrease of 9% as opposed to the previous month as the harvest come to a full swing, averaging at USD 2,034 per Mt. The price of Indonesia black pepper in local currency decreased to an average of IDR 29,917 per Kg from IDR 32,591 per Kg in July.
The farm gate price of Malaysia's black pepper for the 8th month of 2020 was reported with a significant increase of 11% when compared to the previous month averaging at USD 2,391 per Mt. The increase of Malaysia black pepper could be contributed to the increase of demand as well as the appreciation by 2% of the Malaysian Ringgit against US Dollar. In local currency, the price of Malaysia black pepper increased to an average of MYR 10,019 per Kg from MYR 9,226 per Kg.
Furthermore, farm gate price of black pepper in Viet Nam was reported with a decrease by 2% as compared to the previous month, averaging at USD 1,992 per Mt. In local currency, the price of Viet Nam black pepper decreased to an average of VND 47,548 per Kg from VND 48,609 per Kg in July.
The farm gate price of Sri Lankan black pepper was reported with a significant increase of 10% as opposed to July and was reported at an average of USD 2,923 per Mt. Sri Lanka black pepper in local currency increased to an average of LKR 541.58 per Kg from LKR 492.29 per Kg in July.
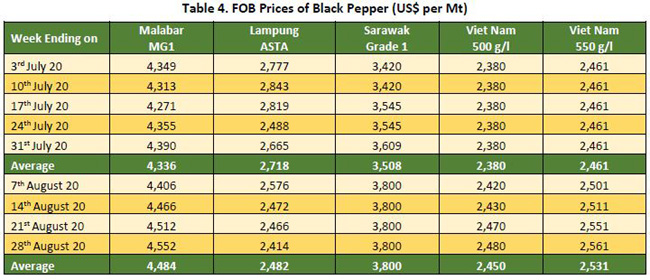
FOB price of black pepper for August 2020 continued the trend of the farm gate price with only Indonesia origin was reported with a decrease. India traded its Malabar black pepper internationally with an increase of 3% when compared to July, averaging at USD 4,484 per Mt (Table 4). Furthermore, the FOB price of Indonesian black pepper was reported with a decrease of 9% as opposed to July, averaging at USD 2,482 per Mt. FOB price of Malaysian black pepper was reported with an increase of 8% when compared to the previous month at an average of USD 3,800 per Mt. FOB price of Viet Nam black pepper 500 g/l and 550 g/l were reported with an increase of 3% respectively as compared to the previous month averaging at USD 2,450 per Mt and USD 2,531 per Mt respectively.
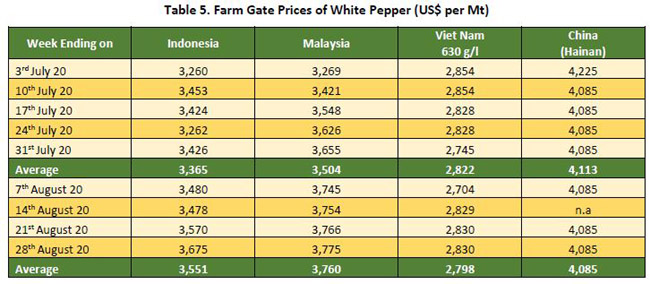
Farm gate prices of white pepper in August 2020 showed a mixed response (Table 5) with only Indonesia and Malaysia origin were reported an increase. Indonesia Muntok white pepper was reported with an increase of 6% as compared to the previous month at an average of USD 3,551 per Mt. In local currency, the price of Muntok white pepper was reported at an average of IDR 52,417 per Kg, an increase of IDR 3,281 per Kg when compared with the previous month. Contrary with black pepper, the increase of Indonesia white pepper could be contributed to the increase of demand while the stock was limited. Farm gate price of Malaysia white pepper was reported with an increase of 7% as opposed to July at an average of USD 3,760 per Mt. Furthermore, Viet Nam white pepper was reported with a decrease of 1% when compared to the previous month, averaging at USD 2,798 per Mt. China white pepper was also reported with a decrease of 1% as opposed to the previous month and was traded at an average of USD 4,085 per Mt locally.
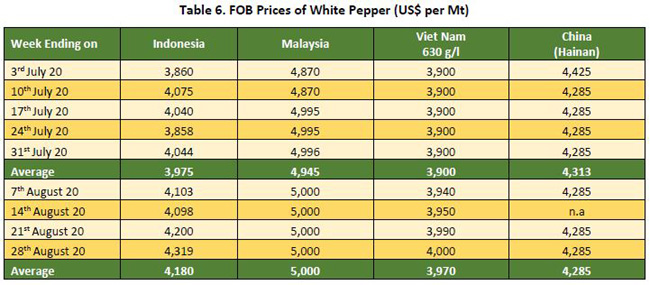
FOB price of white pepper also showed a mix response as only China origin recorded a decrease. Continuing the trend of the farm gate price, FOB price of Indonesia white pepper for August 2020 was reported with an increase of 5% when compared to July, averaging at USD 4,180 per Mt. FOB price of Malaysia white pepper was reported with an increase of 1% as compared to the previous month averaging at USD 5,000 per Mt. Furthermore, FOB price of Viet Nam white pepper was reported with an increase of 2% when compared to the previous month at an average of USD 3,970 per Mt. China white pepper was reported with 1% deficit as opposed to July and was traded at an average of USD 4,285 per Mt internationally (Table 6).
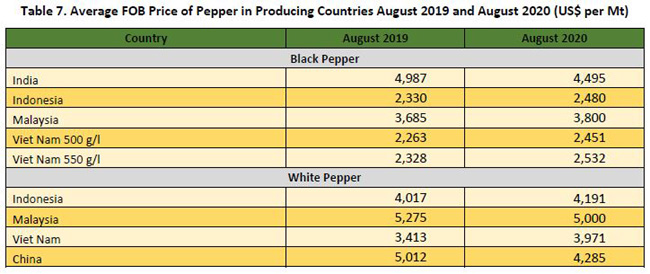
Entering the 8th month of global pandemic, FOB price of pepper in comparison between August 2019 and August 2020 fluctuated. India black pepper in August 2020 was reported with 10% deficit as compared to August 2019 at an average of USD 4,495 per Mt. Furthermore, Indonesia black and white pepper were reported with an increase of 6% and 4% respectively as compared to August 2019 averaging at USD 2,480 per Mt for black pepper and USD 4,191 per Mt. Malaysia black pepper was reported with an increase of 3% as compared to August 2019 averaging at USD 3,800 per Mt whilst Malaysia white pepper was reported with 5% deficit as compared to the same period in 2019 to an average of USD 5,000 per Mt. Furthermore, Viet Nam black pepper 500 g/l, 550 g/l and Viet Nam white pepper were reported with an increase of 8%, 9% and 16% respectively as opposed to the same period in 2019 to an average of USD 2,451 per Mt, USD 2,532 per Mt and USD 3,971 per Mt respectively. China white pepper was reported with 15% deficit when compared to August 2019 and was traded at an average of USD 4,285 per Mt (Table 7).
HIGHLIGHT ON UNITED ARAB EMIRATES
The United Arab Emirates sometimes simply called the UAE, is a country in Western Asia at the southeast end of the Arabian Peninsula on the Persian Gulf, bordering with Oman to the east and Saudi Arabia to the south, as well as sharing maritime border with Qatar to the west and Iran to the north. Spices and herbs are an essential part of United Arab Emirates cuisine. The food is tasty and fragrant because of the various exotic spices and herb utilized to make the food. Therefore, to meet the domestic consumption as well as re-export purpose, United Arab Emirates imported pepper from various pepper producing countries. The pepper import and export of United Arab Emirates showed an increasing trend in the last eight years.
Pepper Import by United Arab Emirates
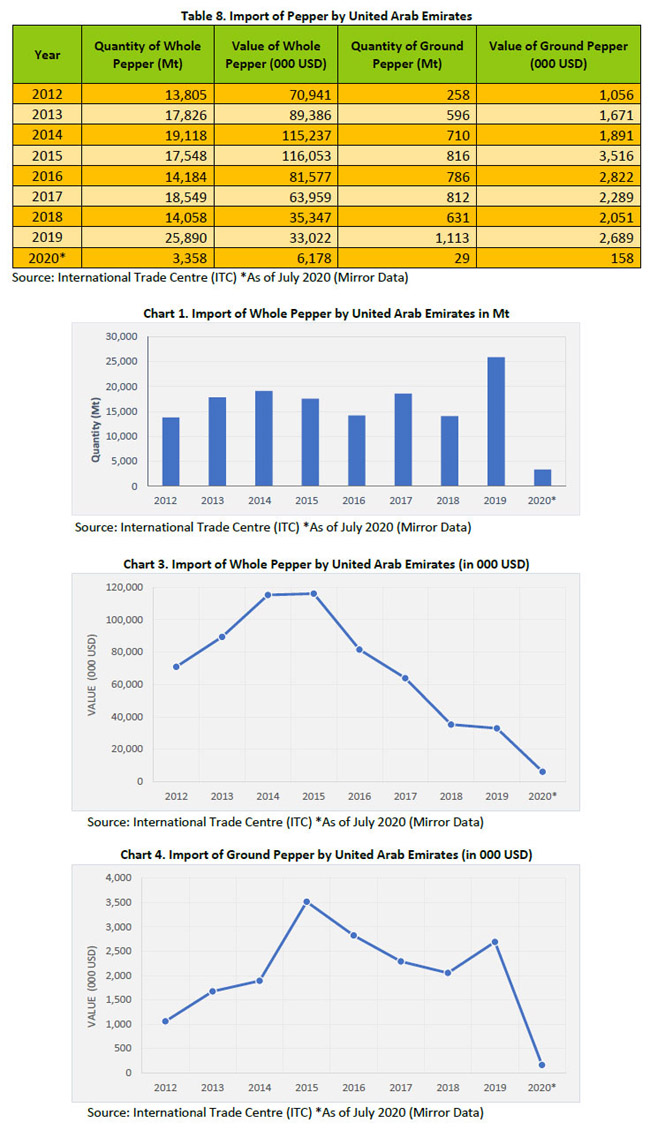
During 2012-2019, United Arab Emirates was reported to have imported a total of 146,700 Mt which comprised of 96% or 140,978 Mt of whole pepper and 4% or 5,722 Mt of ground pepper. Pepper imported by United Arab Emirates during 2012-2019 fluctuated with an average of 18,338 Mt per year with the highest import was reported in 2019 with 27,003 Mt which comprised of 25,890 Mt of whole pepper and 1,113 Mt of ground pepper while the lowest occurred in 2012 with 14,063 Mt which comprised of 13,805 Mt of whole pepper and 258 Mt of ground pepper. The highest increase of pepper import by United Arab Emirates occurred in 2019 with an increase by 84% or 12,314 Mt as compared with the previous year. Furthermore, United Arab Emirates' total expenditure of pepper import during 2012-2019 was reported to be as high as USD 623.5 Million, with the highest expenditure was reported in 2015 with USD 119.5 Million while the lowest recorded in 2019 with USD 35.7 Million. The highest increase of expenditure by United Arab Emirates occurred in 2014 with an increase by 29% or USD 26.0 Million as compared with the previous year.
As of July 2020, United Arab Emirates imported a total of 3,386 Mt (mirror data) which comprised of 99% or 3,358 Mt of whole pepper and 1% or 29 Mt of ground pepper. In addition, during the first 7-month of 2020, United Arab Emirates' total expenditure was reported to be as high as USD 6.3 Million (Table 8).
Pepper Import Price by United Arab Emirates
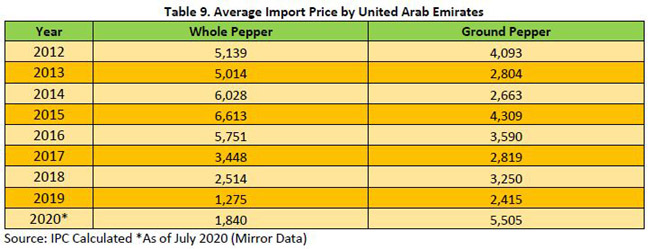
In the past eight years, the average prices of the total pepper imported by United Arab Emirates both whole and ground had fluctuated with a decreasing trend. During 2012-2019, the average price of the total whole pepper imported by United Arab Emirates was reported at USD 4,473 per Mt with the highest average prices recorded in 2015 with USD 6,613 per Mt whilst the lowest price was reported in 2019 with USD 1,275 per Mt. Whilst, the average price of the total ground pepper imported by United Arab Emirates was reported at USD 3,243 per Mt with the highest prices recorded in 2015 with USD 4,309 per Mt whilst the lowest price was reported in 2019 with USD 2,415 per Mt. In 2019, United Arab Emirates average price of the total pepper imported both whole and ground were reported at USD 1,275 per Mt and USD 2,415 per Mt respectively, recording a decreased of 49% and 16% respectively when compared to 2018. As of July 2020, the average price of the total pepper imported by United Arab Emirates was reported at USD 1,840 per Mt for whole pepper and USD 5,505 per Mt for ground pepper (Table 9).
United Arab Emirates Pepper Import by Country of Origins
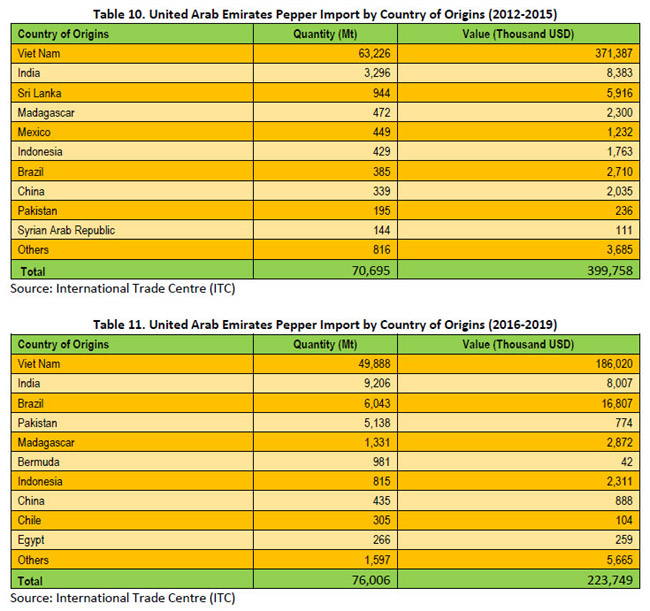
During 2012-2015, United Arab Emirates was reported to have imported a total of 70,695 Mt of pepper and recording a total expenditure for pepper imports as high as USD 399.7 Million. The top ten country of origins of pepper import by United Arab Emirates during 2012-2015 were reported to be Viet Nam with 63,226 Mt (89% of total pepper imported by United Arab Emirates in 2012-2015), India with 3,296 Mt (5%), Sri Lanka with 944 Mt (1%), Madagascar with 472 Mt (1%), Mexico with 449 Mt (1%), Indonesia with 429 Mt (1%), Brazil with 385 Mt (1%), China with 339 Mt (0.5%), Pakistan with 195 Mt (0.3%) and Syrian Arab Republic with 144 Mt (0.2%) (Table 10).
During the next 4 years, pepper import by United Arab Emirates was reported with an increased by 8% as compared to 2012-2015 period, totaling at 76,006 Mt. Although increasing in term of quantity, the pepper import by United Arab Emirates decreased by 44% in terms of value as it recorded a total of USD 223.7 Million (Table 11). The top ten country of origins for United Arab Emirates' pepper during 2016-2019 were reported to be Viet Nam with 49,888 Mt (66% of total pepper imported by United Arab Emirates in 2016-2019), India with 9,206 Mt (12%), Brazil with 6,043 Mt (8%), Pakistan with 5,138 Mt (7%), Madagascar with 1,331 Mt (2%), Bermuda with 981 Mt (1%), Indonesia with 815 Mt (1%), China with 435 Mt (1%), Chile with 305 Mt (0.4%) and Egypt with 266 Mt (0.3%).
Pepper Export by United Arab Emirates
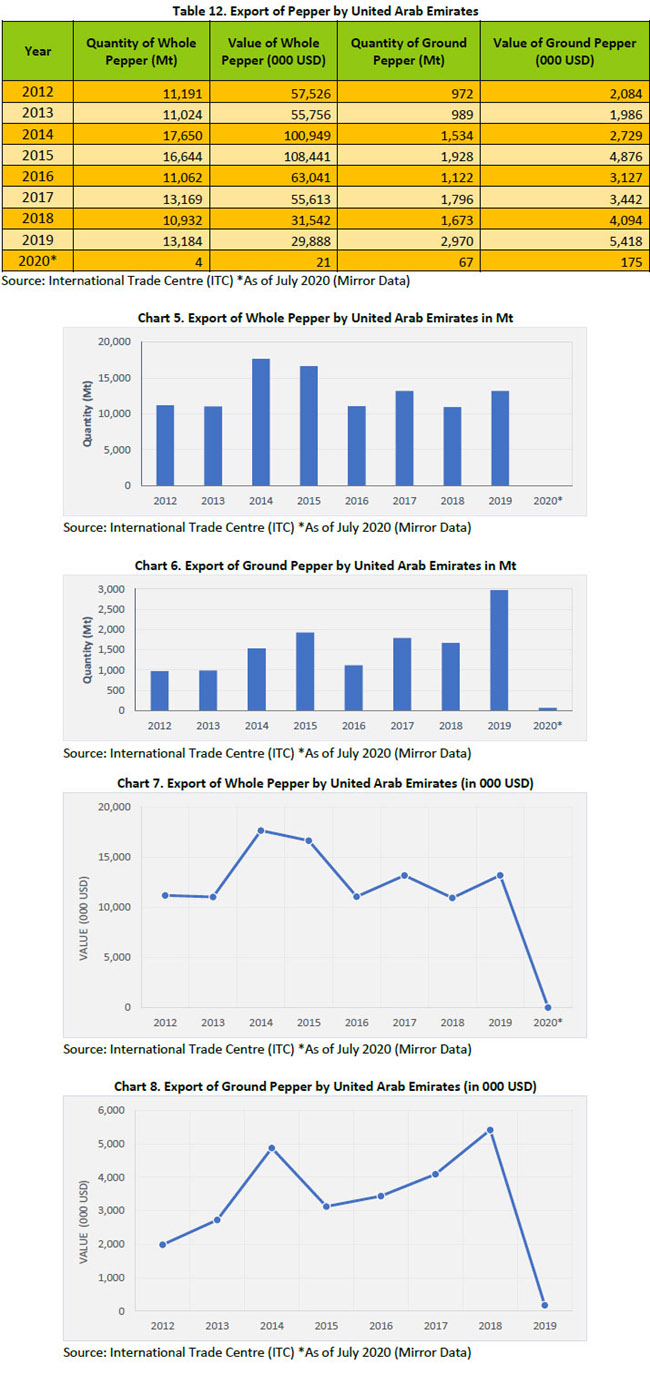
United Arab Emirates also re-export pepper to various countries with most of them are Middle East countries. Pepper export from United Arab Emirates was reported fluctuated with an increasing trend in the last eight years. During 2012-2019, United Arab Emirates was reported to have exported a total of 117,840 Mt which comprised of 89% or 104,856 Mt of whole pepper and 11% or 12,984 Mt of ground pepper. Pepper exported by United Arab Emirates during 2012-2019 was reported at an average of 14,730 Mt per year with the highest export was reported in 2014 with 19,184 Mt which comprised of 92% or 17,650 Mt of whole pepper and 8% or 1,534 Mt of ground pepper while the lowest occurred in 2013 with 12,013 Mt which comprised of 92% or 11,024 Mt of whole pepper and 8% or 989 Mt of ground pepper. The highest increase of pepper export by United Arab Emirates recorded in 2014 with an increase by 60% or 7,171 Mt as compared with the previous year.
Furthermore, United Arab Emirates' total revenue of pepper export during 2012-2019 was reported to be as high as USD 530.5 Million, with the highest expenditure was reported in 2015 with USD 113.3 Million while the lowest occurred in 2019 with USD 35.3 Million. The highest increase of revenue by United Arab Emirates recorded in 2013 with an increase by 80% or USD 45.9 Million as compared with the previous year. As of July 2020 (mirror data), United Arab Emirates exported a total of 71 Mt which comprised of 5% or 4 Mt of whole pepper and 95% or 67 Mt of ground pepper. As of July 2020, United Arab Emirates' total revenue was reported to be as high as USD 196,000 (Table 12).
Pepper Export Price by United Arab Emirates
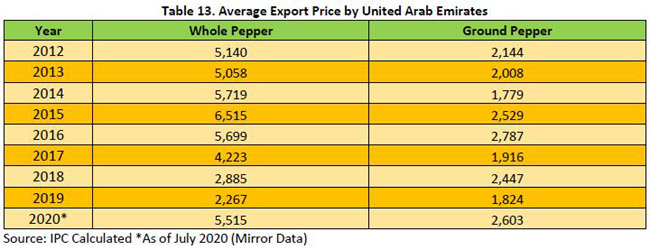
In the past eight years, the average price of the total pepper exported by United Arab Emirates both whole and ground had fluctuated with a decreasing trend. During 2012-2019, the average price of the total whole pepper exported by United Arab Emirates was reported at USD 4,688 per Mt with the highest prices recorded in 2015 at USD 6,515 per Mt whilst the lowest price was reported in 2019 with USD 2,267 per Mt. In addition, the average price of the total ground pepper exported by United Arab Emirates was reported at USD 2,179 per Mt with the highest prices recorded in 2016 with USD 2,787 per Mt whilst the lowest price was reported in 2014 with USD 1,779 per Mt. In 2019, United Arab Emirates' average price of the total pepper export was reported at USD 2,267 per Mt for whole pepper and USD 1,824 per Mt for ground pepper, recording a decreased of 21% and 25% respectively as compared to 2018. As of July 2020, the average price of the total pepper exported by United Arab Emirates was reported at USD 5,515 per Mt for whole pepper and USD 2,603 per Mt for ground pepper (Table 13).
United Arab Emirates Pepper Export by Country of Destinations
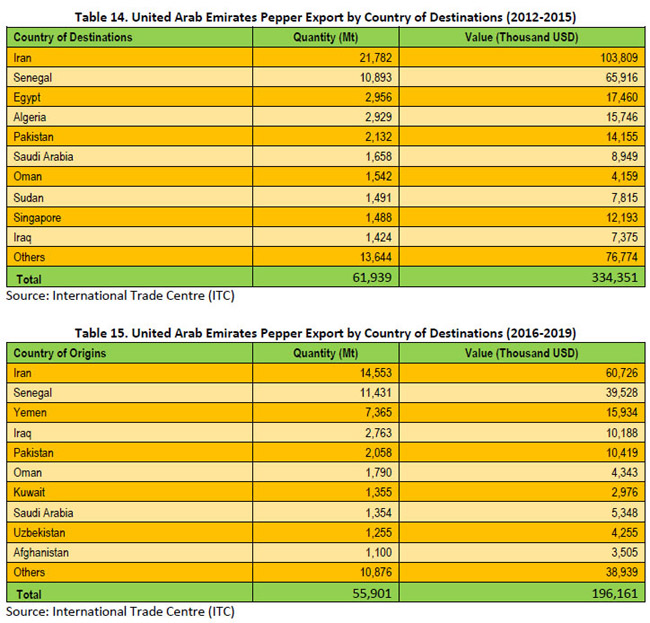
During 2012-2015, United Arab Emirates was reported to have exported a total of 61,939 Mt of pepper and recorded a total revenue of USD 334.3 Million (Table 14). The top ten country of destinations of pepper exported by United Arab Emirates during 2012-2015 were reported to be Iran with 21,782 Mt (35% of total pepper exported by United Arab Emirates in 2012-2015), Senegal with 10,893 Mt (18%), Egypt with 2,956 Mt (5%), Algeria with 2,929 Mt (5%), Pakistan with 2,132 Mt (3%), Saudi Arabia with 1,658 Mt (3%), Oman with 1,542 Mt (2%), Sudan with 1,491 Mt (2%), Singapore with 1,488 Mt (2%) and Iraq with 1,424 Mt (2%).
In the next four years, pepper export by United Arab Emirates was reported with a decreased by 10% as compared to 2012-2015 period totaling at 55,901 Mt. In relation with decreasing in term of quantity, the revenue of United Arab Emirates pepper export decreased by 41% to a total of USD 196.1 Million (Table 15). The top ten country of destinations of pepper exported by United Arab Emirates during 2016-2019 were reported to be Iran with 14,553 Mt (26% of total pepper exported by United Arab Emirates in 2016-2019), Senegal with 11,431 Mt (20%), Yemen with 7,365 Mt (13%), Iraq with 2,763 Mt (5%), Pakistan with 2,058 Mt (4%), Oman with 1,790 Mt (3%), Kuwait with 1,355 Mt (2%), Saudi Arabia with 1,354 Mt (2%), Uzbekistan with 1,255 Mt (2%) and Afghanistan with 1,100 Mt (2%).
Source:
- Brazil, Unofficial source (Coreimex, CSG Trade)
- India: AISEF, NCDEX, Indian Chamber of Commerce & Industry, Spices Board India
- Indonesia: Unofficial source
- Malaysia: Malaysian Pepper Board
- Sri Lanka: Department of Export Agriculture
- Viet Nam : Viet Nam Pepper Association, HCMC
- China: Hainan Pepper Association, China Spice Association
- Office of Agricultural Economics of Thailand
- A.A. SAYIA & Company
- International Trade Centre (ITC) - Geneva
Note: Some of the data in this publication are from the IPC database. The data are obtained from official reports and correspondence between the IPC and Sri Lanka and have been processed based on statistical norms that can be accounted for.
Previous Publications
- MARKET REVIEW - NOVEMBER 2023
- MARKET REVIEW - OCTOBER 2023
- MARKET REVIEW - SEPTEMBER 2023
- MARKET REVIEW - AUGUST 2023
- MARKET REVIEW - JULY 2023
- MARKET REVIEW - JUNE 2023
- MARKET REVIEW - MAY 2023
- MARKET REVIEW - APRIL 2023
- MARKET REVIEW - MARCH 2023
- MARKET REVIEW - FEBRUARY 2023
- MARKET REVIEW - JANUARY 2023
- MARKET REVIEW - DECEMBER 2022
- MARKET REVIEW - NOVEMBER 2022
- MARKET REVIEW - OCTOBER 2022
- MARKET REVIEW - SEPTEMBER 2022
- MARKET REVIEW - AUGUST 2022
- MARKET REVIEW - July 2022
- MARKET REVIEW - June 2022
- MARKET REVIEW - MAY 2022
- MARKET REVIEW - APRIL 2022
- MARKET REVIEW - March 2022
- MARKET REVIEW - February 2022
- MARKET REVIEW - January 2022
- MARKET REVIEW - December 2021
- MARKET REVIEW - November 2021