a UNESCAP Intergovermental Organization
a UNESCAP Intergovermental Organization
Monthly Publication
MARKET REVIEW - October 2020
PRICE HISTORY
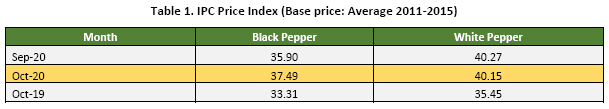
Price index for October 2020 was reported with mixed responses. The price index of black pepper for October 2020 was reported with an increase by 4.4% as compared to the previous month at 37.49 points. When compared with the same period in 2019, the price index of black pepper recorded a much higher increase of 13%. Contrary to black pepper, the price index of white pepper for the 10th month of 2020 was reported with a marginal decrease of 0.3% when compared to September at 40.15 points (Table 1). However, when compared with October 2019 the price index of white pepper was reported with an increase of 13%.
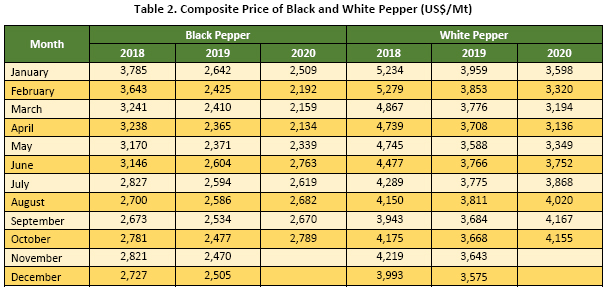
Align with the price index, the composite prices for October were reported with mixed response. Composite price of black pepper was reported at USD 2,789 per Mt (Table 2), recording an increase of USD 119 per Mt as compared with September. Whilst, composite price of white pepper recorded a marginal decrease of USD 12 per Mt as compared to the previous month and was reported at USD 4,155 per Mt.
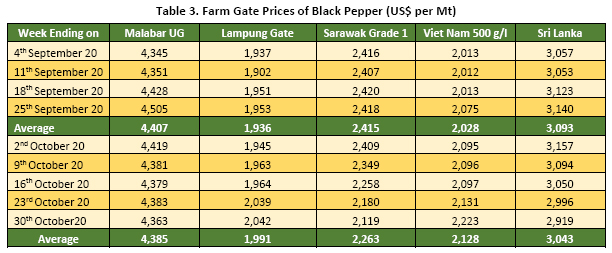
Pepper prices in the 10th month of 2020, showed a mixed response. The farm gate price of black pepper in India was reported with 1% deficit as opposed to September, averaging at USD 4,385 per Mt (Table 3). In the local currency farm gate price of India (Malabar black pepper) was reported at an average of INR 321 per Kg, decreasing from INR 324 per Kg in the previous month.
The price of black pepper in Indonesia (Lampung black pepper) was reported with an increase of 3% to an average of USD 1,991 per Mt as opposed to September 2020 which was partly contributed to the appreciation by 1% of the Indonesia Rupiah against US Dollar. The price of Indonesia black pepper in local currency increased to an average of IDR 29,368 per Kg from IDR 28,739 per Kg in September.
The farm gate price of Malaysia's black pepper for the 10th month of 2020 was reported with 6% deficit when compared to the previous month averaging at USD 2,263 per Mt. In local currency, the price of Malaysia black pepper decreased to an average of MYR 9,339 per Kg from MYR 10,019 per Kg in the previous month.
Furthermore, farm gate price of black pepper in Viet Nam was reported with an increase of 5% as compared to the previous month, averaging at USD 2,128 per Mt. In local currency, the price of Viet Nam black pepper increased to an average of VND 50,864 per Kg or an increase of VND 2,401 per Kg when compared to the previous month.
The farm gate price of Sri Lankan black pepper was reported with 2% deficit as opposed to September 2020 and was reported at an average of USD 3,043 per Mt. Sri Lanka black pepper in local currency decreased to an average of LKR 558.29 per Kg from LKR 574.71 per Kg in September.
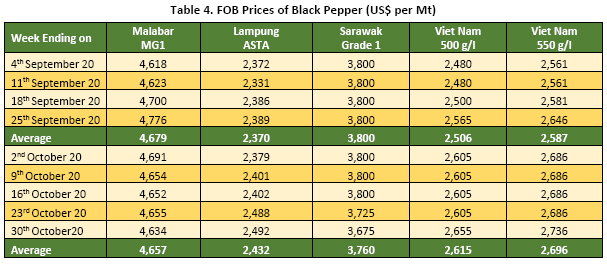
FOB price of black pepper for October 2020 showed a rather positive outlook with only Malaysia origin was reported with a decrease. The FOB price of Malabar black pepper from India was reported stable with a marginal decrease averaging at USD 4,657 per Mt (Table 4). Furthermore, the FOB price of Indonesian black pepper was reported with an increase of 3% as opposed to September, averaging at USD 2,432 per Mt. FOB price of Malaysian black pepper was reported with 1% deficit as opposed to the previous month and was traded at an average of USD 3,760 per Mt. FOB price of Viet Nam black pepper 500 g/l and 550 g/l were reported with an increase of 4% respectively as compared to the previous month averaging at USD 2,615 per Mt and USD 2,696 per Mt respectively.
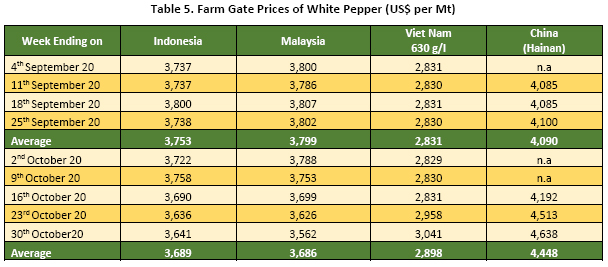
Farm gate prices of white pepper in September 2020 were reported with a mixed response (Table 5). Indonesia Muntok white pepper was reported with 2% deficit as compared to the previous month to an average of USD 3,689 per Mt. In local currency, the price of Muntok white pepper was reported at an average of IDR 54,500 per Kg, a decrease of IDR 1,136 per Kg when compared to the previous month. Farm gate price of Malaysia white pepper was reported with 3% deficit as opposed to September at an average of USD 3,686 per Mt. Furthermore, Viet Nam white pepper was reported with an increase of 2% when compared to the previous month, averaging at USD 2,898 per Mt. China white pepper was reported with a significant increase of 9% as compared to September and was traded at an average of USD 4,448 per Mt in domestic market.
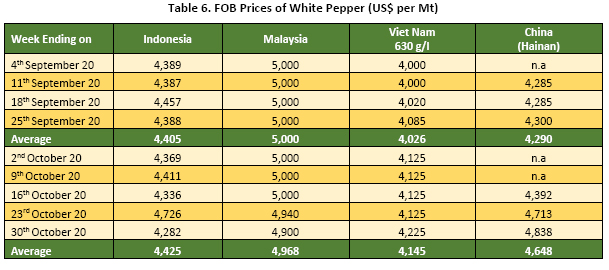
FOB price of white pepper showed a rather positive outlook with only Malaysia origin was reported with a decrease. FOB price of Indonesia white pepper for October 2020 was reported stable with a marginal increase, averaging at USD 4,425 per Mt. FOB price of Malaysia white pepper was reported with 1% deficit as compared to the previous month to an average of USD 4,968 per Mt. Furthermore, FOB price of Viet Nam white pepper was reported with an increase of 3% when compared to the previous month at an average of USD 4,145 per Mt. China white pepper was reported with a significant increase of 8% when compared to September and was traded at an average of USD 4,648 per Mt internationally (Table 6).
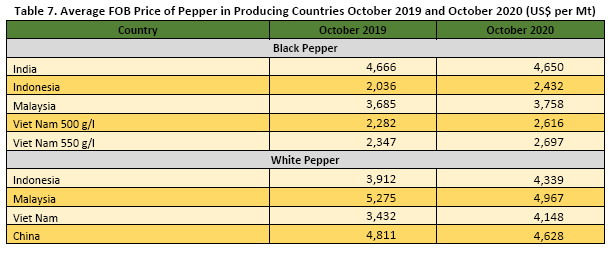
Entering the 10th month of global pandemic, FOB price of pepper in comparison between October 2019 and October 2020 fluctuated. India black pepper in October 2020 was reported stable with a marginal decrease at an average of USD 4,650 per Mt as compared to the same period in 2019. Furthermore, Indonesia black and white pepper were reported with an increase of 19% and 11% respectively as compared to October 2019, averaging at USD 2,432 per Mt for black pepper and USD 4,339 per Mt for white pepper. Malaysia black pepper was reported with an increase of 2% as compared to October 2019, averaging at USD 3,758 per Mt. Whilst, Malaysia white pepper was reported with 6% deficit as compared to the same period in 2019 to an average of USD 4,967 per Mt. Furthermore, Viet Nam black pepper 500 g/l, 550 g/l and Viet Nam white pepper were reported with an increase of 15%, 15% and 21% respectively as opposed to the same period in 2019 to an average of USD 2,616 per Mt, USD 2,697 per Mt and USD 4,148 per Mt respectively. China white pepper was reported with 4% deficit when compared to October 2019 and was traded at an average of USD 4,628 per Mt (Table 7).
HIGHLIGHT ON INDIA
Production and Productivity
India is widely known as a spice country. A large number of spices are grown and developed in the country, especially in southern part of India. One of the most popular spices from India is Malabar black Pepper which is cultivated mainly in the state of Karnataka, Kerala, Tamil Nadu and other states in southern India. During 2015-2020, Karnataka State was reported as the biggest pepper producer in India with an average of annual production of 28,000 Mt.
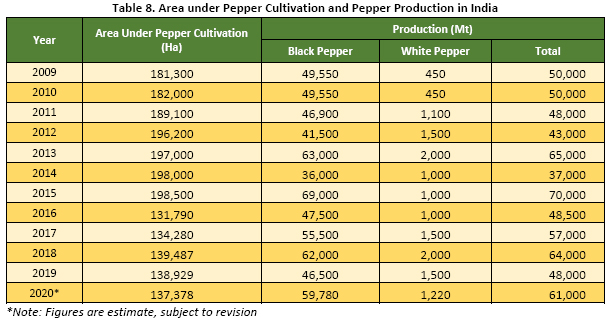
During 2009 to 2015 the area under pepper cultivation in India had shown an increasing trend. An increase of 9% in term of area under pepper cultivation was reported when comparing 2009 to 2015. In 2016, the area under pepper cultivation in India was reported with a significant drop of 34% when compared to 2015. As from 2016, the area of pepper cultivation in India had fluctuated to 2019 with an increasing trend. In 2019, India planted pepper on 138,929 Ha of area, recording a 23% decrease over the course of 11 years (Table 8). In 2018, saw the devastating floods which affected most of the South India state Kerala. The devastating floods which contributed to the unusually extreme rainfall combined with the overcapacity of the reservoir storage, was a contributing factor to the decrease of area under pepper cultivation in 2019 as compared to 2018. In addition, the area under pepper cultivation for 2020 was estimated to decrease slightly by 1% to 137,378 Ha.
Pepper production of India had fluctuated since 2009. Pepper production of India was reported to have recorded a decrease of 4% in the past 11 years as it was reported to have produced a total of 48,000 Mt in 2019 which comprised of 46,500 Mt of black pepper and 1,500 Mt of white pepper. The highest production of India pepper in the past 11 years was reported in 2015 with 70,000 Mt which comprised of 69,000 Mt of black pepper and 1,000 Mt of white pepper. The increase in production was mainly due to favorable weather condition during the crop season and also the favorable price in 2014 which was at an average of SD 10,444 per Mt (farm gate). Thus, encouraged farmers to cultivate more area for pepper and to well maintain current pepper plants. The production of India pepper for 2020 was estimated with an increase of 27% when compared to 2019 at 61,000 Mt.
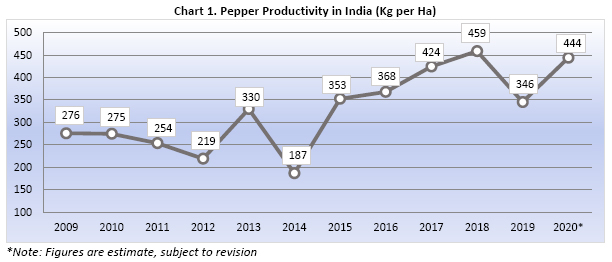
Pepper productivity in India in the past 11 years fluctuated with a positive trend (Chart 1). From 2009 until 2019 pepper productivity in India had been reported with an increase by 25% totaling at 346 Kg per Ha in 2019. The highest pepper productivity in India in the past 11 years was reported in 2018 with 459 Kg per Ha. In 2020, pepper productivity in India was estimated to increase by 29% as compared with the previous year to a total of 444 Kg per Ha.
Pepper Export from India
Though, being considered as one of the biggest pepper producers in the world, India's contribution to the global pepper export come fourth behind Viet Nam, Brazil and Indonesia as majority of the pepper does not leave the country. India is considered as one of the highest consumers of pepper among pepper producing countries just behind China.
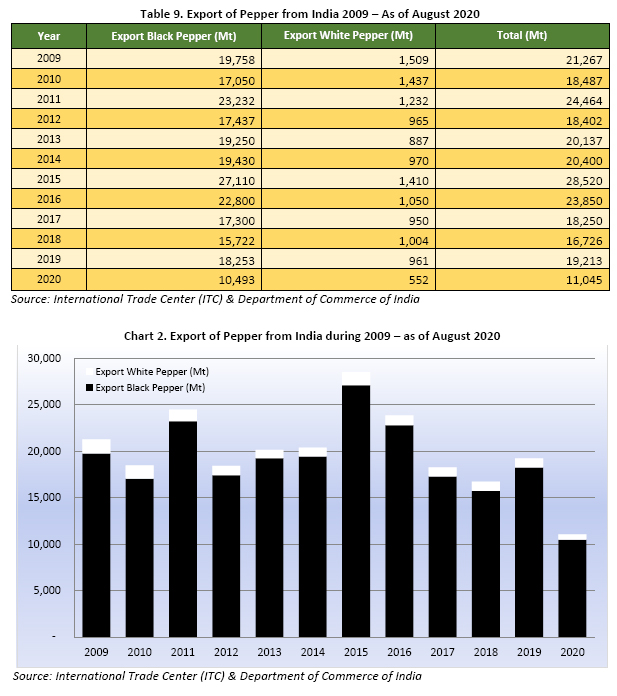
Since 2009 until 2019 there had been a 10% (Table 9) decrease in term of quantities of pepper exports from India. The highest quantity of pepper export from India was reported during 2015 which amounted to 28,520 Mt whilst the lowest occurred in 2018 with 16,726 Mt. The low number of pepper export in 2018 could be contributed to the devastating floods occurred during that year. In 2019, India was reported to have exported a total of 19,213 Mt of pepper, recording an increase of 15% as compared to 2018. As of August 2020, India exported a total of 11,045 Mt which comprised of 10,493 Mt of black pepper and 552 Mt of white pepper.
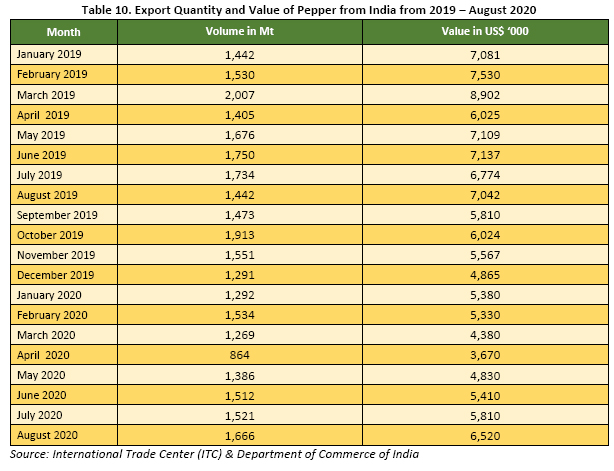
The quantity of pepper exports from India had reportedly fluctuated from January 2019 up to August 2020. The total export by India in 2019 was reported at 19,213 Mt with total value as high as USD 79.8 Million. The average pepper export from India in 2019 was reported to be 1,601 Mt per month with the highest reported in March which reached 2,007 Mt whilst the lowest was reported in December with 1,291 Mt (Table 10). The high level of exports during March were due to India harvest season which occurs during December-March. Furthermore, the total pepper export from India as of August 2020 was reported to be 11,044 Mt with total value of USD 41.3 Million, recording a decrease of 15% in terms of quantity of pepper exported by India when compared to the same period in 2019. The decrease of pepper export from India as of August 2020 could be contributed to the global pandemic of Corona Virus.
Pepper from India is exported to various countries around the world, mostly to America and European countries (Table 11). As of August 2020, the top 10 country of destinations for India pepper were reported to be United States of America with 3,231 Mt (Contributed to 29% of the total India pepper export as of August 2020), United Kingdom with 824 Mt (7.5%), Canada with 757 Mt (6.9%), Spain with 615 Mt (5.6%), Sweden with 570 Mt (5.2%), Germany with 403 Mt (3.6%), Italy with 361 Mt (3.3%), Russia with 339 Mt (3.1%), Australia with 328 Mt (3%) and Japan with 323 Mt (2.9%).

Pepper oleoresin and pepper oil are some of Indian added value of pepper product. Pepper oleoresin is a concentrated, resinous extract obtained by conventional solvent extraction or supercritical fluid extraction. As the name implies, pepper oleoresin consists of a blend of the essential oil, resinous matter of the spice and related compounds like the pungent alkaloid piperine. Whilst, Pepper oil or Pepper essential oil is a natural blend of mainly terpenes and their derivatives that form a clear yellowish green to bluish green color. It is responsible for the characteristic aroma of pepper. Today, this essential oil is commercially extracted from the pepper berries mainly by the process of steam distillation.
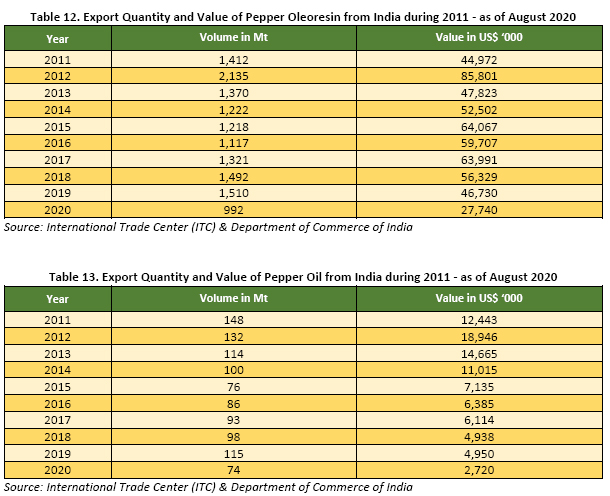
Pepper oleoresin export from India was reportedly fluctuated during 2011-2019. During 2011 to 2019 pepper oleoresin export from India was reported with an increase by 7% in term of quantity resulting to 1,510 Mt of pepper oleoresin with value of USD 46.7 Million being exported by India in 2019. As of August 2020, pepper oleoresin export from India was reported with a decrease by 1% in term of quantity as compared with the same period in 2019 totaling at 992 Mt and amounting to USD 27.7 Million (Table 12).
Pepper oleoresin from India is exported to various countries in America, Europe and Asia. As of August 2020, the top five country of destinations of pepper oleoresin from India were United States of America which imported 190 Mt (Contributed to 19% of the total pepper oleoresin exported by India as of August 2020), Germany with 114 Mt (11%), China with 83 Mt (8%), The Netherlands with 76 Mt (8%) and United Kingdom with 52 Mt (5%).
During 2011-2019, pepper oil export from India was reportedly fluctuated with a decreasing trend. In 2019, India was reported to have exported a total of 115 Mt with value of USD 4.9 Million. Thus, recording a decrease of 23% in terms of quantity when compared to 2011. As of August 2020, pepper oil export from India was reported with a decrease by 7% in term of quantity as compared with the same period in 2019 totaling at 74 Mt and amounting to USD 2.7 Million (Table 13).
Pepper oil from India is exported to various countries in America, Europe and Asia. As of August 2020, the top five country of destinations of pepper oil from India were United States of America which imported 14 Mt (Contributed to 19% of the total pepper oil exported by India as of August 2020), Germany with 6 Mt (8.5%), The Netherlands with 6 Mt (8%), Spain with 5 Mt (6%) and France with 5 Mt (6%).
Pepper Price
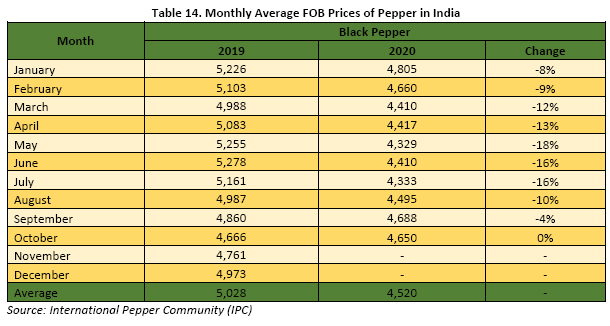
The price of pepper in India was reported to fluctuate with a decreasing trend during January 2019 up to September 2020 which could be attributed to the world supply of pepper which significantly exceeded global demand as well as the development of the global pandemic of Corona Virus.
In 2019, the average FOB price of
Indian black pepper was reported at USD 5,028 per Mt, the highest price of Indian black pepper was reported in June with an average of USD 5,278 per Mt whilst the lowest occurred in October with USD 4,666 per Mt. As of October 2020, the average FOB price of Indian black pepper was reported at USD 4,520 per Mt. Thus, recording a decrease of 8% as compared to the same period in 2019. As of October 2020, the highest price of Indian black pepper was reported in January with USD 4,805 per Mt, recording a deficit by 8% as compared to the same period in 2019. The lowest price of India black pepper was reported during May 2020 which reached as low as USD 4,329 per Mt, recording a deficit by 18% as compared to the same period in 2019 (Table 14).
Source:
• Brazil, Unofficial source (Coreimex, CSG Trade)
• India: AISEF, NCDEX, Indian Chamber of Commerce & Industry
• Indonesia: Unofficial source
• Sri Lanka: Sri Lankan Pepper Board
• Sri Lanka: Department of Export Agriculture
• Viet Nam : Viet Nam Pepper Association, HCMC
• China: Hainan Pepper Association, China Spice Association
• International Trade Centre (ITC) - Geneva
Note: Some of the data in this publication are from the IPC database. The data are obtained from official reports and correspondence between the IPC and have been processed based on statistical norms that can be accounted for.
Previous Publications
- MARKET REVIEW - NOVEMBER 2023
- MARKET REVIEW - OCTOBER 2023
- MARKET REVIEW - SEPTEMBER 2023
- MARKET REVIEW - AUGUST 2023
- MARKET REVIEW - JULY 2023
- MARKET REVIEW - JUNE 2023
- MARKET REVIEW - MAY 2023
- MARKET REVIEW - APRIL 2023
- MARKET REVIEW - MARCH 2023
- MARKET REVIEW - FEBRUARY 2023
- MARKET REVIEW - JANUARY 2023
- MARKET REVIEW - DECEMBER 2022
- MARKET REVIEW - NOVEMBER 2022
- MARKET REVIEW - OCTOBER 2022
- MARKET REVIEW - SEPTEMBER 2022
- MARKET REVIEW - AUGUST 2022
- MARKET REVIEW - July 2022
- MARKET REVIEW - June 2022
- MARKET REVIEW - MAY 2022
- MARKET REVIEW - APRIL 2022
- MARKET REVIEW - March 2022
- MARKET REVIEW - February 2022
- MARKET REVIEW - January 2022
- MARKET REVIEW - December 2021
- MARKET REVIEW - November 2021