a UNESCAP Intergovermental Organization
a UNESCAP Intergovermental Organization
Monthly Publication
Market Review - December 2018
The year 2018, pepper industry endured yet another challenging year. Continuous price volatility over the year had been one of the major issues. The overflowing products which had been circulating the market in the past 12 months, pushed down the prevailing prices of pepper in all origins. Viet Nam alone was estimated to produce around 40% of the global pepper production with a high number of 205,000 Mt. Combined with the global stock brought forward from 2017, which was estimated at a high 111,000 Mt, had seen the market with a surplus of product that kept pushing down the price. In the hope of answering the seriousness of the situation Viet Nam Government has assured that there wouldn\'t be any more pepper cultivation areas expansion, instead, they would work to reform pepper sector towards high-quality products and food safety.
This year also saw the devastating floods which happened in Kerala, India. Kerala is famous for being the major pepper cultivation area in India has contributed to more than 65% of the total pepper cultivation area. These series of floods which ravaged Kerala between July and August 2018 was contributed to the unusually extreme rainfall combined with the overcapacity of the reservoir storage. The floods did not only result in the high number of the death toll, but it was also reported that around 58,379 Ha of agricultural lands were wiped out with 26,614 Ha of them were black pepper plantation. In the recent survey conducted by Indian Institute of Spice Research (IISR), it was estimated that pepper industry in India recorded overall damage of 40% and would witness production loss for around 10,700 Mt in 2019. Thus, making the 2019 projection number of pepper production in India to decrease to the level between 45,000 - 50,000 Mt which would mean a decrease of around 25% as opposed to 2018 production.
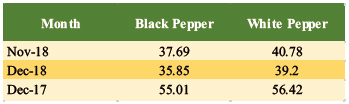
The index price of black pepper and white pepper was reported to weaken at the end of 2018. In December, the index price of black pepper was reported to be at 35.85, declined 1.84 points compared to the previous month. When compared to December 2017, the index price of black pepper in December 2018 was reported to be weakening 19.16 points. Furthermore, the index price of white pepper also experienced the same trend, which recorded a decline rate of 1.58 points compared to the previous month. When compared with the index price in December 2017, the index price of white pepper in December 2018 was reported to weaken 17.22 points. The weakening of the price index this month is due to the weakening of the average pepper prices at the local level.
Table 1. IPC Price Index (Base price: Average 2011-2015)
As the year ended and the final official figure of export balance for October 2018 received from the respective customs of each producing countries, slight adjustment of the composite prices for black and white pepper were reported. According to the Ministry of Industry Brazil had shipped out a total of 72,580 Mt pepper in 2018 which was 11% more than the estimated figure at 65,000 Mt. Meanwhile, other origins\' data was updated till November except for India at October. Thus, calculation of composite price for black pepper in December 2018 was reported declining by 5% compared to the previous month\'s composite price. Currently, the composite price of black pepper is reported to be at US$ 2,667 per Mt. Furthermore, the composite price of white pepper was reported at US$ 4,056 per Mt, a decline of 4% compared to the previous month, thus recording a loss of US$ 164.
Table 2. Composite Price of Black and White Pepper (US$/MT)
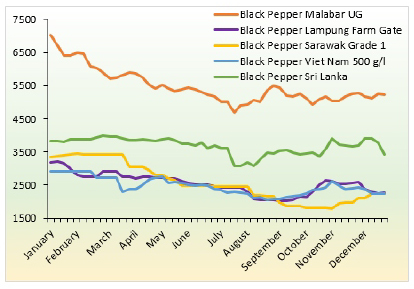
Local prices of black pepper in 2018 showed significant fluctuation with a declining trend. Since the beginning of 2018 until the end of 2018, local prices of black pepper decreased by 22% in India, 27% in Indonesia, 35% in Malaysia, 22% in Viet Nam, and 2% in Sri Lanka.
In dollar terms, the highest local prices of black pepper at the end of 2018 was India at a price of US$ 5,187 per Mt which was a decrease of 19% as compared to the same period in 2017. Whereas black pepper with the second highest local price was from Sri Lanka with the average price in December 2018 reaching US$ 3,750 per Mt which became the only origin that recorded an increase by 3% as opposed to the same period the previous year at US$ 3,655. Furthermore, local prices of black pepper from Indonesia, Malaysia, and Viet Nam had almost the same price range of US$ 2,294; US$ 2,211, and US$ 2,277 per Mt which meant recording loss of 28%, 33% and 31% respectively as compared to December 2017.
In local currency, the average price of black pepper at the farm level in December 2018 is reported to be IDR 33,263 per kg in Indonesia, VND 53,389 per kg in Viet Nam, RS 367 per kg in India, RM 9.2 in Malaysia, and LKR 672 in Sri Lanka.
Table 3. Monthly Average of Local Prices of Black Pepper in US$ per MT
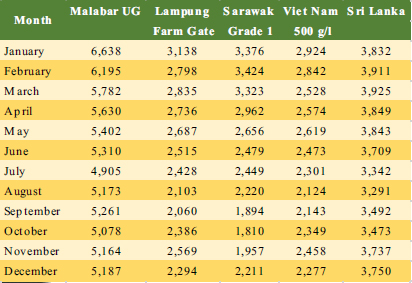
Figure 1. Monthly Average of Local Prices of Black Pepper in US$ per MT
Local prices of white pepper also experienced fluctuations like black pepper. The price of white pepper was showing a declining trend. Compared with the beginning of 2018, the price of white pepper at the local level has decreased by 25% in Indonesia, 26% in Malaysia, and 21% in Viet Nam.
In dollar terms, white pepper prices at the local level in Indonesia, Malaysia and Viet Nam in December 2018 had a close price range. Nevertheless, white pepper prices in Malaysia was reported to be the highest with a value of US$ 3,743 per Mt which recorded a loss of 24% as compared to December 2017 at US$ 4,951. Second highest was Viet Nam with a value of US$ 3,737 per Mt which also recorded a major 28% loss as opposed to the previous year. The lowest and the biggest loss was recorded by Indonesia with a value of US$ 3,622 per Mt and 32% loss when compared with December 2017.
In local currency, the average price of white pepper at the local level is reported to be IDR 52,526 per kg in Indonesia, VND 87,500 per kg in Viet Nam, and RM 15.6 per kg in Malaysia.
Table 4. Monthly Average of Local Prices of White Pepper in US$ per MT
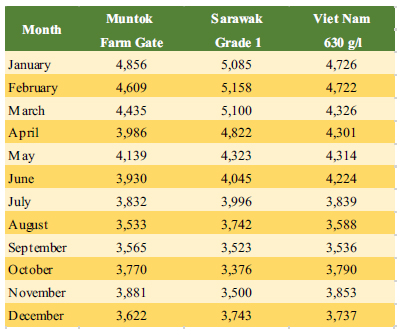
Figure 2. Monthly Average of Local Prices of White Pepper in US$ per MT
Following the continuous overflowing pepper in the market, prices of all origins were pushed down and some even offered discounted prices. Brazil and Viet Nam remained to be the two origins with lowest prices offered throughout 2018.
FOB prices of black pepper from all origin during 2018 experienced a downward trend. Throughout 2018, India\'s price showed a declining trend which resulted in a 20% loss by the end of 2018 at US$ 5,469. Thus, when compared to the same period in December 2017, India\'s price showed a decline rate of 17%. Black pepper in Indonesia was shipped with a total loss of 28% by the end of 2018 at US$2,782, which meant a loss of 31% was also recorded when compared to December 2017. By the end of 2018, both Viet Nam 500 and 550 g/l recorded loss of 19% and 21 % which was considerably lesser when compared with the loss endured in 2017 at 40% and 37% respectively.
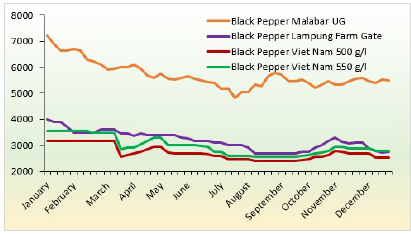
Table 5. Monthly Average of FOB Prices of Black Pepper in US$ per MT
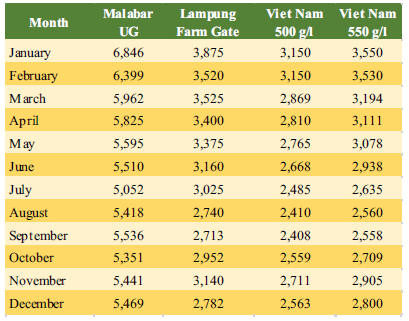
Figure 3. Monthly Average of FOB Prices of Black Pepper in US$ per MT
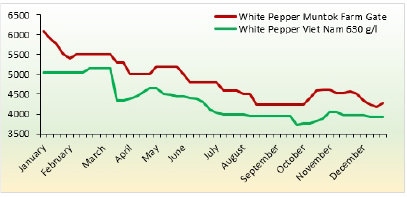
Though the loss experienced was slightly lesser than in 2017 which was 44%, FOB price of Indonesia Muntok white pepper reported a 27% loss. By the end of 2018, the FOB price of Indonesia was at US$ 4,263 per Mt which showed a decrease of 30% as opposed to December 2017. Albeit slightly less Viet Nam also experienced a similar total loss of 40% in 2017 whereas FOB price of white pepper Viet Nam in 2018 reported a loss of 22%. December 2018 showed the FOB price of white pepper at the level of US$ 3,938 which was a decrease of 32% when compared to the same period in the previous year.
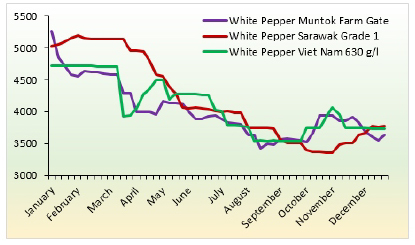
Table 6. Monthly Average of FOB Prices of White Pepper in US$ per MT
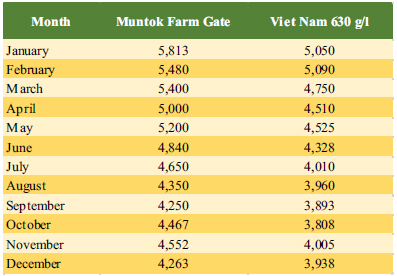
Figure 4. Monthly Average of FOB Prices of White Pepper in US$ per MT
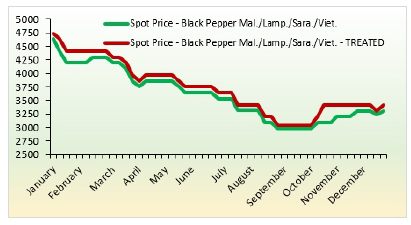
Spot prices of black pepper in New York in 2018 experienced a declined trend. Spot prices in New York experienced the best prices in 2014-2015, and then in 2016 until now has been showing a declining trend. The drastic decline occurred between 2016 - 2017, and continued in 2017 thru 2018 albeit not as drastic in the previous period. In December 2018 the spot prices of black pepper decreased 24-25 % compared to the beginning of January 2018. Majors spot prices drop occurred during March - April and August - September which recorded drop between 10% up to 11%. Whilst slight improvement occurred during October thru November which recorded an increase between 7% - 12%.
Table 7. Monthly Average of Spot Prices of Black Pepper in New York in US$ per MT
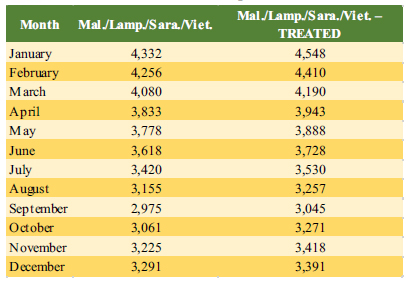
Figure 5. Monthly Average of Spot Prices of Black Pepper in US$ per MT
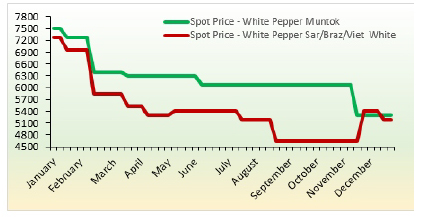
Spot prices of white pepper in New York also experienced a trend similar to spot prices of black pepper which showed a declining tendency for the year 2018. Throughout the year the decline in spot prices was reported to reach 28% for Muntok White Pepper, and 26% for white pepper from Malaysia, Brazil and Viet Nam. Spot prices of Muntok white pepper when compared with other origins albeit still experienced declining trend, they projected different movement throughout the year 2018. Muntok white pepper was traded higher and showed more stability as opposed to other origins. It was traded steady at US$ 6,065/Mt during June till early November 2018. The end of year showed Spot prices of white pepper at level US$ 5,292 and US$ 5,182 per Mt for Muntok and other origins respectively.
Table 8. Monthly Average of Spot Prices of White Pepper in New York in US$ per MT
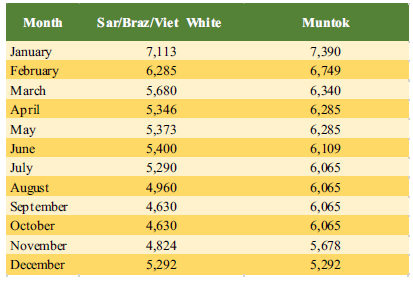
Figure 6. Monthly Average of Spot Prices of White Pepper in US$ per MT
Previous Publications
- MARKET REVIEW - October 2021
- MARKET REVIEW - September 2021
- MARKET REVIEW - August 2021
- MARKET REVIEW - July 2021
- MARKET REVIEW - June 2021
- MARKET REVIEW - May 2021
- MARKET REVIEW - April 2021
- MARKET REVIEW - March 2021
- MARKET REVIEW - February 2021
- MARKET REVIEW - January 2021
- MARKET REVIEW - December 2020
- MARKET REVIEW - November 2020
- MARKET REVIEW - October 2020
- MARKET REVIEW - September 2020
- MARKET REVIEW - August 2020
- MARKET REVIEW - JULY 2020
- MARKET REVIEW - JUNE 2020
- MARKET REVIEW - MAY 2020
- MARKET REVIEW - APRIL 2020
- MARKET REVIEW - MARCH 2020
- MARKET REVIEW - February 2020
- MARKET REVIEW - January 2020
- MARKET REVIEW - December 2019
- MARKET REVIEW - November 2019
- MARKET REVIEW - October 2019