a UNESCAP Intergovermental Organization
a UNESCAP Intergovermental Organization
Monthly Publication
MARKET REVIEW - June 2019
PRICE HISTORY
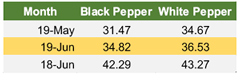
Price index in June 2019 showed a positive trend. Price index of black pepper was reported with an increase of 3.35 points as compared with May 2019. When compared with the same period in 2018, price index of black pepper recorded 18% loss. Furthermore, price index of white pepper was reported at 36.53 (Table 1) recording a 5.3% increase or gaining 1.85 points as compared with the previous month but 6.74 points decline when compared with the same period in 2018.
Table 1. IPC Price Index (Base price: Average 2011-2015)
Composite prices for June 2019 was reported with a rather significant increase as compared with May 2019. Composite price of black pepper was reported at USD 2,590 per Mt, recording 10.6% spike or increase by USD 249 per Mt (Table 2). Furthermore, composite price of white pepper recorded a spike of USD 192 per Mt or increase by 5.3% when compared with May 2019 and was reported at USD 3,780 per Mt.
Table 2. Composite Price of Black and White Pepper (US$/Mt)
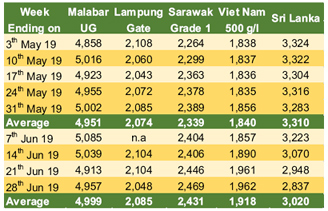
Pepper prices in the 6th month of 2019,showed a rather positive outlook as only Sri Lanka origin reported a decrease (Table 3). The farm gate of black pepper in India was reported at an average of USD 4,999 per Mt. Thus, recording a slight increase of 1% when compared with May 2019. The increase in price of black pepper in India could be contributed due to the strengthening of Indian's Rupee towards US Dollar (averaging at INR 69.44 for USD 1). The price of black pepper in Indonesia (Lampung Black Pepper) strengthened when compared to May 2019. The farm gate prices of Lampung black pepper for June 2019 was reported to be at USD 2,085 per Mt.Recording an increase of USD 11 per Mt or 1% compared to the previous month. The strengthening of Indonesian Rupiah towards US Dollar contributed to the increase of pepper prices in Lampung as the price in local currency remained at the same level at an average of IDR 30,000 per Kg.
The Farm gate prices of black pepper in Malaysia was reported with significant increase. In June 2019, the farm gate price of Malaysia black pepper was reported at an average of USD 2,431 per Mt, recording a 4% spike as compared to May 2019 which was averaging at USD 2,339 per Mt. The increase of Malaysian black pepper price was not only helped by the strengthening of Malaysia's Ringgit towards US Dollar but was also contributed to the price increase in local currency. At the end of June 2019, Malaysian black pepper was traded with an average of MYR 10,134 per Mt or 3% higher as opposed to May 2019.
Farm gate price of black pepper in Viet Nam for June 2019 was reported with significant increase. The farm gate of black pepper in Viet Nam was reported to be at USD 1,918 per Mt, recording an increase of USD 78 per Mt or 4% spike compared to the previous month. The increase in price of black pepper in Viet Nam could be contributed to the price increase in local currency with an average of VND 45,450 per Kg.Contrary to other origin, the farm gate of Sri Lanka black pepper was reported with a significant deficit. In June 2019, the farm gate price of black pepper in Sri Lanka was reported at USD 3,020 per Mt recording 9% deficit as compared to May 2019 which recorded an average of USD 3,310 per Mt. The decrease in price of black pepper in Sri Lanka could be contributed to the harvest season currently in full swing, thus, pushing the local price to an average of LKR 531.27 per Kg. Furthermore, the weakening of Sri Lanka Rupee against US Dollar slightly affected the price of pepper in Sri Lanka.
Table 3. Farm Gate Prices of Black Pepper (US$ per Mt)
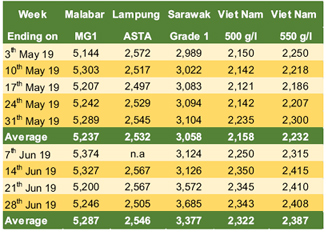
FOB prices of black pepper were reported to have experienced the similar response as farm gate prices. In June 2019, the FOB price of black pepper in Indonesia was reported to have slight increase of 1% as compared with the previous month and was reported at USD 2,546 per Mt. The increasing of FOB price of black pepper in Indonesia was the effect of strengthening Indonesian Rupiah towards US Dollar.The increasing of FOB price was also encountered in black pepper from Viet Nam. Black pepper with a quality of 500 g/l and 550 g/l were reported to have significant increased by 8% and 7% respectively as compared to the previous month. The increasing of Viet Nam FOB price of black pepper was the effect from lack of offering and also farmers keep waiting for a better price. Furthermore, the FOB price of black pepper in India was also reported to have increase of 1% as compared to May 2019. Increase from India FOB price could be contributed to strengthening of Indian's Rupee towards US Dollar. The significant increase encountered in FOB Price black pepper from Malaysia as reported Malaysia's FOB prices as released by Malaysian Pepper Board experienced a significant 10% spike as opposed to the previous week, averaging at USD 3,377 per Mt (Table 4).
Table 4. FOB Prices of Black Pepper (US$ per Mt)
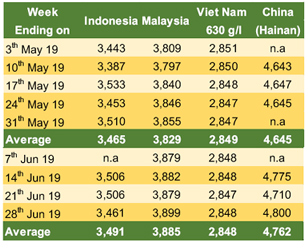
Farm gate prices of white pepper in Indonesia, Malaysia and China showed an increasing trend, while Viet Nam farm gate price of white pepper was reported stable (Table 5). Despite being in harvesting period, the farm gate price of white pepper in Indonesia was reported with a 1% increase as compared to the previous month and was traded at an average of USD 3,491 per Mt. In local currency, the price of Muntok white pepper was reported to be stable at an average of IDR 50.000 per Kg. Following the increasing trend, farm gate price of Malaysia was reported with a 1% increase as compared with the previous month and was traded at an average of USD 3,885 per Mt. Furthermore, in China, the farm gate price of white pepper was reported with3% increase as compared with previous month at an average of USD 4,762 per Mt.
Table 5. Farm Gate Prices of White Pepper (US$ per Mt)
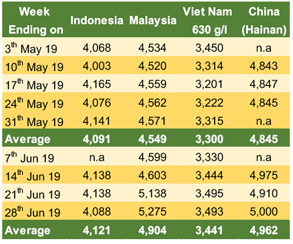
FOB price of white pepper was reported to have experienced the similar responses as farm gate. FOB price of white pepper in Indonesia for June 2019 was reported with slight increase by 1% when compared to May 2019 and was reported at an average of USD 4,121 per Mt. Furthermore, Malaysia reported a significant increase by 8% as compared to the previous month, averaging at USD 4,904 per Mt. Viet Nam and China origins were reported increasing by 4% and 2% respectively and were traded at an average of USD 3,441 per Mt and USD 4,962 per Mt respectively (Table 6).
Table 6. FOB Prices of White Pepper (US$ per Mt)
HIGHLIGHT ON MALAYSIA
Production and Productivity
Malaysia is a federal constitutional monarchy in Southeast Asia. It consists of thirteen states and three federal territories and has a total landmass of 329,847 square kilometers (127,350 sq mi) separated by the South China Sea into two similarly sized regions, Peninsular Malaysia and Malaysian Borneo. Land borders are shared with Thailand, Indonesia, and Brunei, and maritime borders exist with Singapore, Vietnam, and the Philippines. The capital city is Kuala Lumpur, while Putrajaya is the seat of the federal government. In 2010 the population exceeded 27.5 million, with over 20 million living on the Peninsula.
Malaysia has had one of the best economic records in Asia, with GDP growing an average 6.5% for almost 50 years. The economy has traditionally been fuelled by its natural resources, but is expanding in the sectors of science, tourism, commerce and medical tourism. The state of Sarawak, the main Pepper producing region in Malaysia, accounts for more than 98% of the country's annual pepper production. Black and white Pepper is produced and exported from this state. The other producing areas are Sabah and Peninsular Malaysia.Locally, the crop currently sustains more than 67,000 farming families and households, providing them with employment and income. Malaysia's Pepper harvest begins in May with the main markets for Malaysian peppers were Japan, China, Taiwan, Korea and Singapore.
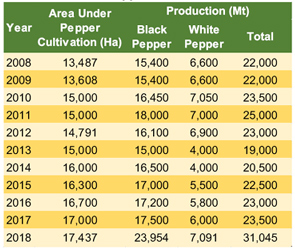
Since 2008,the area under pepper cultivation in Malaysia had shown an increasing trend. In 2011, the area under pepper cultivation was reported to increase by 11% to 15,000 Ha. However, a slight decrease of 1% in term of area of pepper cultivation was reported in 2012. Starting 2013, the area of pepper cultivation in Malaysia had continuously increased to 2018. In 2018, Malaysia planted pepper on 17,437 Ha of area, recording a 29% increase or 3,950 Ha of area when compared to 2008 (Table 7).
Pepper production of Malaysia was reported to show a fluctuated movement since 2008. Pepper production of Malaysia was reported to have recorded an increase of 41% from 2008 until 2018 as it was reported to have produced a total of 31,045 Mt in 2018 which comprised of 23,954 Mt of black pepper and 7,091 Mt of white pepper which by far the highest production of pepper in the past 12 years.
Table 7. Area Under Pepper Cultivation and Pepper Production
Source: IPC & MPB July 2019
Pepper productivity in Malaysia in the past 12 years was reported relatively stable with a slight negative trend in the first 6 years. From 2008 until 2018 pepper productivity in Malaysia was reported to increase by 9%. Furthermore, the highest pepper productivity in Malaysia was also reported in 2018 with 1,780 Kg per Ha. In 2018, pepper productivity in Malaysia was reported to increase by 29% as compared with the previous year (Chart 1).
Chart 1
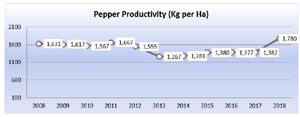
*Note: Productivity = Total production (Mt)/Area under pepper cultivation (Ha) X 1,000
Pepper Export from Malaysia
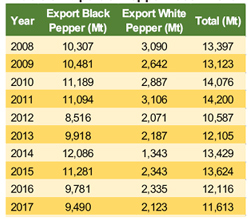
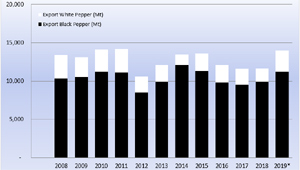
Known as one of pepper origin country, Malaysia considered as one of the biggest pepper producers in the world, Malaysia's contribution to the global pepper export come fifth behind Viet Nam, Brazil, Indonesia and India. Since 2008 until 2018 there had been a 13% (Table 8) decrease in term of quantities of pepper exports from Malaysia. The highest quantity of pepper export from Malaysia was reported during 2011 which amounted to 14,200 Mt which comprised of 11,094 Mt of black pepper and 3,106 Mt of white pepper.
Year 2018 saw a slightincrease trend in terms of export by Malaysia. Malaysia was reported to have exported a total of 11,660 Mt. Thus, recording an increase of 47 Mt as compared with the previous year which comprised of 9,880 Mt of black pepper and 1,780 Mt of white pepper. With a promising harvest in sight and last year high production, It is projected that Malaysia export of pepper in 2019 will increase by 20% to 14,000 Mt.
Table 8. Export of Pepper 2008 - 2019
*Note: Figure are estimate, subject to revision
Chart 2
*Note: Figure are estimate, subject to revision
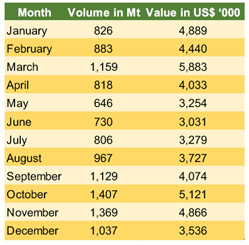
The number of pepper exports from Malaysia had reportedly fluctuated during 2018. The average pepper export from Malaysia was 981 Mt per month with an average value of USD 4.2 Million per month. In 2018, the highest export from Malaysia occurred in October with quantities reaching 1,407 Mt (Table 9).
Pepper from Malaysia is exported to various countries in Africa, America, Asia, Australia and Europe. In 2018, the top five destination country of pepper exports from Malaysia were Japan (accounted for 28% of market share) which reported to reach 3,320 Mt and were able to meet roughly 35% of the total pepper imported by Japan. In the second place, China was reported to have imported a total of 2,751 Mt from Malaysia or roughly 47% of the total imports pepper by China. Furthermore, Taiwan was reported to have imported Malaysian pepper with a total of 1,348 Mt or 40% of total imports by Taiwan. Viet Nam was reported to have imported a total 1,285 Mt of Malaysian pepper or 4% of total imports of pepper by Viet Nam and in the fifth place, Singapore was reported to have imported a total 743 Mt or 13% of total imports of pepper by Singapore.
Table 9. Export Quantity and Value of Pepper 2018
Source: International Trade Center - Geneva
--------
Source:
• Brazil, Unofficial source (Coreimex, CSG Trade)
• India: AISEF, NCDEX, Indian Chamber of Commerce & Industry
• Indonesia: Unofficial source
• Malaysia: Malaysian Pepper Board
• Sri Lanka: Department of Export Agriculture
• Viet Nam : Viet Nam Pepper Association, HCMC
• China: Hainan Pepper Association, China Spice Association
• A.A. SAYIA & Company
• International Trade Centre (ITC) - Geneva
Note: Some of the data in this publication are from the IPC database. The data are obtained from official reports and correspondence between the IPC and Malaysia and have been processed based on statistical norms that can be accounted for.
Previous Publications
- MARKET REVIEW - September 2019
- MARKET REVIEW - August 2019
- MARKET REVIEW - July 2019
- MARKET REVIEW - June 2019
- MARKET REVIEW - May 2019
- MARKET REVIEW - April 2019
- MARKET REVIEW - March 2019
- MARKET REVIEW - February 2019
- MARKET REVIEW - January 2019
- Market Review - December 2018
- Market Review - November 2018
- Market Review - October 2018
- Market Review - September 2018
- Market Review - August 2018
- Market Review - July 2018
- Market Review - June 2018
- Market Review - May 2018
- Market Review - April 2018
- Market Review - March 2018
- Market Review - February 2017
- Market Review - January 2017
- Market Review - December 2017
- Market Review - November 2017
- Market Review - October 2017
- Market Review - September 2017