a UNESCAP Intergovermental Organization
a UNESCAP Intergovermental Organization
Monthly Publication
MARKET REVIEW - December 2019
PRICE HISTORY
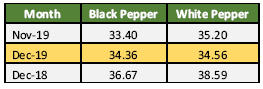
The year 2019 was closed with price index being reported with mixed responses. In the last month of the 2019, price index for black pepper was reported with a 2.9% increase as compared with the previous month at 34.36 point (Table 1) and when compared with the same period in 2018, price index for black pepper experienced a 6% loss. In 2019, the price index for black pepper was at an average 33.66 point. Thus, recording a 7.51 points loss when compared with the average in 2018 which was reported at 41.17 point.
Contrary to black pepper, the price index of white pepper for the last month of 2019 experienced a loss by 1.8% as opposed to the previous month and was reported at 34.56 point. When compared with the same period in 2018, price index for white pepper suffered a greater loss by 10%. In 2019, the price index for white pepper was reported at an average of 36.08 point, recording a 17% loss when compared with the average in 2018 which was reported at 43.58 point
Table 1. IPC Price Index (Base price: Average 2011-2015)
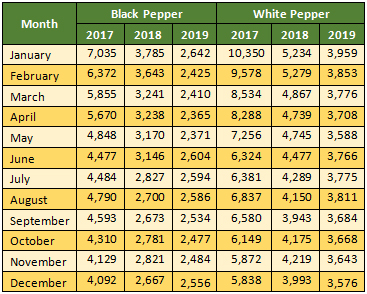
The end of 2019 was reported with a mixed response for composite price of black and white pepper. Composite price of black pepper in December was reported at USD 2,556 per Mt, recording an increase of USD 71 per Mt as compared to the previous month. Furthermore, the average composite price of black pepper for the year 2019 was reported at USD 2,504 per Mt, recording an 18% loss when compared with the average in 2018 which was reported at USD 3,063 per Mt.
Composite price of white pepper for December 2019 was reported at USD 3,576 per Mt (Table 2), recording a loss by USD 67 per Mt as opposed to the previous month. For the year 2019, the average composite price of white pepper was reported at USD 3,734 per Mt, recording a 17% deficit as opposed with the average in 2018 which was reported at USD 4,509 per Mt.
Table 2. Composite Price of Black and White Pepper (US$/Mt)
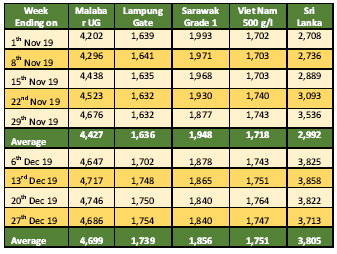
Pepper prices at the end of 2019, showed a mixed response with Sri Lanka origin recorded the highest increase as opposed to the previous month. Close to the harvest season, the farm gate price of black pepper in India was reported with rather significant increase by 6% as opposed to the previous month at an average of USD 4,699 per Mt (Table 3). In the local currency farm gate price of India black pepper was traded at an average of INR 334 per Kg. The increase of India black pepper price could also be contributed to the increase of the domestic demand due to the onset of winter. The price of black pepper in Indonesia (Lampung black pepper) was also reported with an increase of 6% as opposed to the previous month with an average of USD 1,739 per Mt. The increase of Indonesia black pepper could be contributed to the decreasing of stock in market and the farmers' reluctant to release at the current price point.
In December 2019 though Malaysian Ringgit strengthened against US Dollar, the farm gate price of black pepper in Malaysia was reported with a deficit at an average of USD 1,856 per Mt which was the lowest ever in 2019. Thus, recording a deficit by 5% as compared to November 2019. The farm gate price of black pepper Malaysia in the local currency dropped to an average of MYR 7.7 per Kg from MYR 8.0 per Kg in November 2019.
Farm gate price of black pepper in Viet Nam for December 2019 was reported to have increased by 2% as opposed to previous month averaging at USD 1,751 per Mt. Whilst, Sri Lanka black pepper was reported with a significant increase by 27% as opposed to the previous month and was reported at an average of USD 3,805 per Mt.
Table 3. Farm Gate Prices of Black Pepper (US$ per Mt)
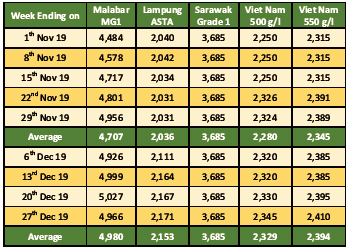
FOB price of black pepper for December showed positive outlook as only Malaysia origin was reported stable. India was reported with an increase of 6% when compared to the previous month at an average of USD 4,980 per Mt (Table 4). Furthermore, the FOB price of black pepper in Indonesia was also reported with an increase of 6% as opposed to the previous month averaging at USD 2,153 per Mt. Contrary to the farm gate level, FOB price of Malaysian black pepper was reported stable at an average of USD 3,685 per Mt. furthermore, FOB price of Viet Nam black pepper 500 g/l and 550 g/l were reported with an increase of 2% respectively to an average of USD 2,329 per Mt and USD 2,394 per Mt respectively.
Table 4. FOB Prices of Black Pepper (US$ per Mt)
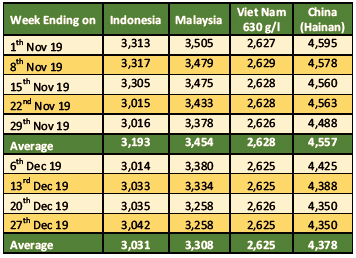
Farm gate prices of white pepper from most origins showed negative outlook (Table 5) with only Viet Nam origin was reported stable. Muntok white pepper was reported with a 5% decrease as compared to the previous month and was traded at an average of USD 3,031 per Mt. In local currency, the price of Muntok white pepper decreased to an average of IDR 42,550 per Kg from IDR 44,595 per Kg in November 2019. Farm gate price of Malaysia white pepper was also reported with a deficit of 4% as compared with the previous month and was traded at an average of USD 3,308 per Mt. Furthermore, Viet Nam white pepper was reported stable at an average of USD 2,625 per Mt. Whilst, China white pepper was traded with a 4% deficit as opposed to the previous month at an average of USD 4,378 per Mt which was the lowest ever in 2019.
Table 5. Farm Gate Prices of White Pepper (US$ per Mt)
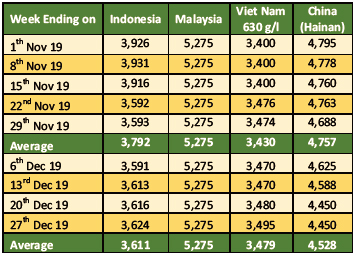
FOB price of white pepper showed a mixed response with only Viet Nam origin was reported with an increase. FOB price of Indonesia white pepper for December 2019 was reported with a deficit by 5% when compared to November 2019 and was reported at an average of USD 3,611 per Mt. Furthermore, FOB price of Malaysia white pepper continued to be reported stable and unchanged. FOB price of Viet Nam white pepper was reported with an increase of 1% as compared to the previous month averaging at USD 3,479 per Mt. Whilst, FOB price of white pepper in China was reported with a deficit by 5% when compared to the previous month and was traded at an average of USD 4,528 per Mt (Table 6).
Table 6. FOB Prices of White Pepper (US$ per Mt)
HIGHLIGHT ON CHINA
Production and Productivity
China is known as white pepper producing country which mostly produced in Hainan province, hence, known as Hainan white pepper. During 2008-2010 the productive area under pepper cultivation in China had shown an increasing trend with a 6% increase recorded from 2008 till 2010 which amounted to a total of 17,498 Ha. In 2011 the productive area under pepper cultivation in China recorded a 5% decrease as compared to the previous year with a total of 16,568 Ha. Since 2012, the productive area of pepper cultivation in China had continuously increased to 2018. In 2018, China planted pepper on 20,000 ha of area, recording a 21% increase over 11 years (Table 7).
Furthermore, for the year 2019 the area of pepper cultivation was estimated to increase by 15% to 23,000 Ha. The increase of area of pepper plantation would be highly contributed to the high domestic demand of pepper as China is known to be one of the biggest consumers of pepper in the world.
China production of pepper during the course of 11 years fluctuated with a rather positive trend. Pepper production of China was reported to have recorded an increase of 25% in the past 11 years as it recorded to have produced a total of 35,000 Mt in 2018. The highest production of China pepper in the past 11 years was reported in 2018 with 35,000 Mt whilst the lowest production occurred in 2009 with 22,800 Mt. However, in the year 2019 production of China pepper was estimated to experience a 9% decrease when compared with 2018 to a total of 32,000 Mt as some areas are still fairly new and in nursery phase.
Table 7. Productive Area under Pepper Cultivation and Pepper Production in China
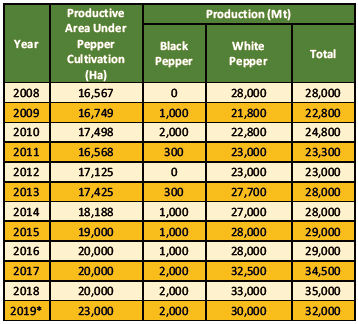
*Note: Figures are estimate, subject to revision
Pepper productivity in China in the past 12 years was reported to be fluctuated. During 2008-2012 pepper productivity in China was reported with a decrease by 21% with 1,343 Kg per Ha. whilst, in the following year pepper productivity in China was reported with an increase of 20% with 1,607 Kg per Ha. Furthermore, during 2013-2016 pepper productivity in China was reported with a 10% deficit to a total 1,450 Kg per Ha. Furthermore, between 2016-2018, pepper productivity in China saw an increase of 21% with 1,750 Kg per Ha. In the past 12 years pepper productivity in China was reported to have increased by 4%. The highest pepper productivity in China was reported in 2018 with 1,750 Kg per Ha whilst, the lowest China pepper productivity occurred in 2012 with 1,343 Kg per Ha.
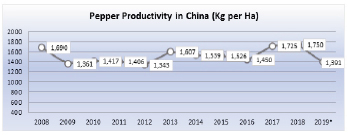
*Note: Figures are estimate, subject to revision
Pepper Export from China
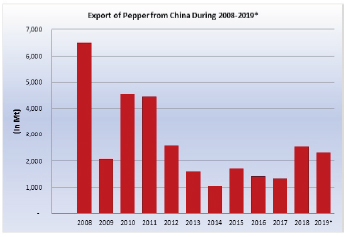
China is known as pepper producer in the world, pepper from China is widely traded in Asia, America and European Countries. Between 2008 until 2018 there had been a 61% (Table 8) decrease in number of pepper exports from China. The highest pepper export occurred in 2008 with 6,509 Mt whilst the lowest export occurred in 2014 with 1,041 Mt. In 2018, pepper export from China was reported at 2,522 Mt which was significant increase by 89% as opposed to the previous year. As of November 2019, China export of pepper was reported at 2,337 Mt thus, recording an increase by 1% as compared to the same period in 2018.
Table 8. Export of Pepper from China 2008 - 2019
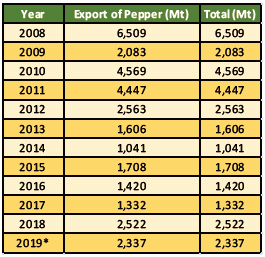
*Note: As of November 2019
*Note: As of November 2019
The number of pepper exports from China has reportedly fluctuated in 2019. As of November 2019, the total export by China was reported at 2,337 Mt with total value as high as USD 13.5 Million. The average pepper export from China was 212 Mt per month with an average value of USD 1.2 Million per month. As of November 2019, the highest export occurred in August with quantities reaching 526 Mt (Table 9). The high level of exports during that period correlated closely to China harvest season so that the stock of pepper was relatively high.
Pepper from China is exported to various countries in Asia, America, Europe and Australia. As of November 2019, pepper exports from China to Germany was reported to reach 690 Mt and were able to meet roughly 3% of the total imported pepper by Germany. Following Germany, North Korea was reported to have imported a total of 454 Mt or roughly 100% of the total imports of pepper by North Korea, United States of America by 307 Mt, Hong Kong with 277 Mt or 100% of the total imports of pepper by Hong Kong and Australia with 94 Mt or 3% of the total imports by Australia.
Table 9. Export Quantity and Value of Pepper from China as of November 2019
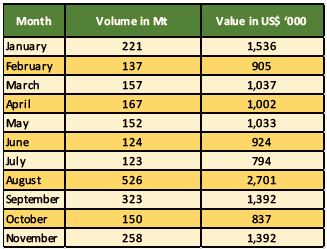
Source: International Trade Center - Geneva
Pepper Import by China
The number of pepper import by China has reportedly fluctuated in 2019. As of November 2019, the total import by China recorded with 10,710 Mt with total value as high as USD 36.4 Million. The average of pepper import by China was 974 Mt per month with an average value of USD 3.3 Million per month. As of November 2019, the largest imports occurred in September with quantities reaching 2,605 Mt while the lowest imports occurred in May with 322 Mt (Table 10).
The top five countries of origins of China's pepper as of November 2019 were reported to be Indonesia which was reported to reach 4,244 Mt and were able to meet roughly 40% of the total imported pepper by China. Following Indonesia, Viet Nam was reported to have exported a total of 3,015 Mt or roughly 28% of the total imports, Malaysia with 1,973 Mt or 18% of the total imports of pepper, Brazil with 876 Mt or 8% of the total imports and India with 254 Mt or 2% of the total imports.
However, based on mirror data taken from China trade counterpart, China was reported to have imported a total of 63,790 Mt as of November 2019, thus, making China the second biggest importer of pepper in the world just behind United States. According to this mirror data, China's number one exporter was reported to be Viet Nam with 56,095 Mt as of November 2019.
Table 10. Import Quantity and Value of Pepper from China as of November 2019
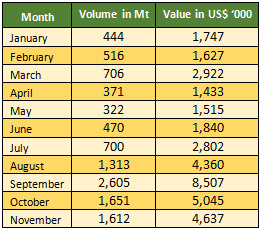
Source: International Trade Center - Geneva
Pepper Price
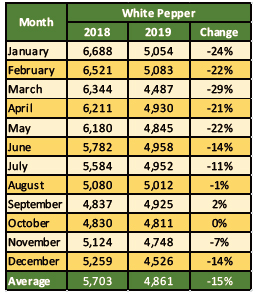
The average FOB price of white pepper in China slipped down significantly which could be attributed to the world supply of pepper which significantly exceeded the global demand. In 2019, the average FOB price of white pepper was reported at USD 4,861 per Mt, recording a decreased of 15% as compared to the average price in 2018. In 2018, the highest average FOB price of China white pepper was reported to have reached USD 6,688 per Mt (Jan 2018) whilst the lowest of average FOB price of China white pepper was reported in October with USD 4,830 per Mt. Whilst in 2019 ,the highest average price of China white pepper was USD 5,083 per Mt (February 2019), recording a 22% decreased as compared to the same period in 2018 whilst the lowest average FOB price of China white pepper occurred in March 2019 with USD 4,487 per Mt (Table 11).
Table 11. Monthly Average FOB Prices of White Pepper in China
Source:
- Brazil, Unofficial source (Coreimex, CSG Trade)
- India: AISEF, NCDEX, Indian Chamber of Commerce & Industry, Spices Board India
- Indonesia: Unofficial source
- Malaysia: Malaysian Pepper Board
- Sri Lanka: Department of Export Agriculture
- Viet Nam : Viet Nam Pepper Association, HCMC
- China: Hainan Pepper Association, China Spice Association
- Office of Agricultural Economics of Thailand
- A.A. SAYIA & Company
- International Trade Centre (ITC) - Geneva
Note: Some of the data in this publication are from the IPC database. The data are obtained from official reports and correspondence between the IPC and Sri Lanka and have been processed based on statistical norms that can be accounted for.
Previous Publications
- MARKET REVIEW - September 2019
- MARKET REVIEW - August 2019
- MARKET REVIEW - July 2019
- MARKET REVIEW - June 2019
- MARKET REVIEW - May 2019
- MARKET REVIEW - April 2019
- MARKET REVIEW - March 2019
- MARKET REVIEW - February 2019
- MARKET REVIEW - January 2019
- Market Review - December 2018
- Market Review - November 2018
- Market Review - October 2018
- Market Review - September 2018
- Market Review - August 2018
- Market Review - July 2018
- Market Review - June 2018
- Market Review - May 2018
- Market Review - April 2018
- Market Review - March 2018
- Market Review - February 2017
- Market Review - January 2017
- Market Review - December 2017
- Market Review - November 2017
- Market Review - October 2017
- Market Review - September 2017