a UNESCAP Intergovermental Organization
a UNESCAP Intergovermental Organization
Monthly Publication
MARKET REVIEW - March 2021
PRICE HISTORY
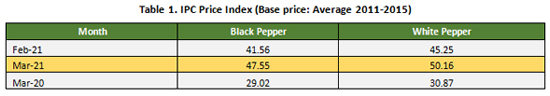
The price index of pepper for 3rd month of 2021 was reported with a positive outlook as the price index of black pepper recorded a significant increase of 14.4% as compared to the previous month to 47.55 points. It further recorded a hefty 64% increase when compared with the same month in the previous year. Inline yet slightly lower, the price index of white pepper for March 2021 was reported with an increase of 10.9% as compared to the previous month to 50.16 points (Table 1). It also recorded a significant increase of 62% when compared with the same month in 2020.
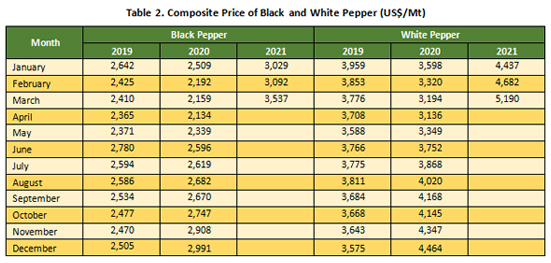
Similar to the price index, the composite price of pepper was also reported with an increasing trend. The composite price of black pepper for March 2021 was reported at USD 3,537 per Mt (Table 2), recording a substantial increase of USD 445 per Mt as compared to the previous month. The composite price of white pepper in the 3rd month of 2021 was also reported with a significant increase of USD 508 per Mt as compared to February 2021 to USD 5,190 per Mt.
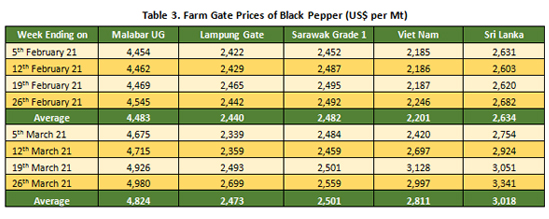
Pepper prices in the 3rd month of 2021 showed a positive outlook. The farm gate price of black pepper in India was reported with an increase of 8% as compared to the previous month, averaging at USD 4,824 per Mt (Table 3). In the local currency farm gate price of India (Malabar black pepper) was reported at an average of INR 353 per Kg or an increase of INR 2.76 as compared to the previous month.
The farm gate price of black pepper in Indonesia (Lampung black pepper) was reported with an increase of 1% as opposed to February to an average of USD 2,473 per Mt. The price of Indonesia black pepper in local currency increased to an average of IDR 36,773 per Kg from IDR 34,263 per Kg in February.
The farm gate price of Malaysia's black pepper for the 3rd month of 2021 was also reported with an increase of 1% when compared to February, averaging at USD 2,501 per Mt. In local currency, the price of Malaysia black pepper increased to an average of MYR 10.3 per Kg from MYR 10.0 per Kg in February.
Farm gate price of black pepper in Viet Nam was reported with a significant increase of 28% as compared to February, averaging at USD 2,811 per Mt. In local currency, the price of Viet Nam black pepper increased to an average of VND 67,783 per Kg or an increase of VND 15,316 per Kg when compared to the previous month. It was reported that Viet Nam pepper price has significantly kept increasing after Tet Holiday. Thus, making Viet Nam pepper market to be unpredictable as it affected processors, industrial manufactures and growers. The increase was contributed to the limited volume of pepper traded in Viet Nam.
The farm gate price of Sri Lankan black pepper was reported with an increase of 15% as opposed to February and was reported at an average of USD 3,018 per Mt.
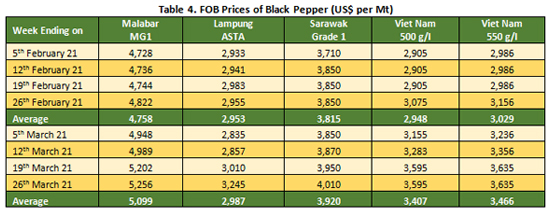
FOB price of black pepper for March 2021 also showed positive outlook with no origin was reported with a decrease. The FOB price of Malabar black pepper from India was reported with an increase of 7% as compared to the previous month, averaging at USD 5,099 per Mt (Table 4). Furthermore, the FOB price of Indonesian black pepper was reported with an increase of 1% as opposed to February, averaging at USD 2,987 per Mt. FOB price of Malaysian black pepper was reported with an increase of 3% as compared to previous month, averaging at USD 3,920 per Mt. Furthermore, FOB price of Viet Nam black pepper 500 g/l and 550 g/l were reported with an increase of 16% and 14% respectively as compared to the previous month, averaging at USD 3,407 per Mt and USD 3,466 per Mt respectively.
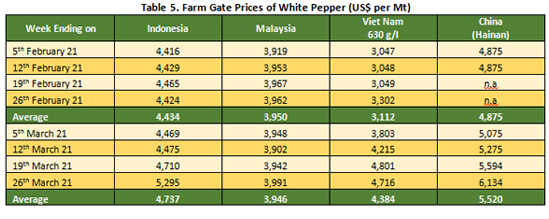
Farm gate prices of white pepper in March 2021 also showed positive outlook with only Malaysia recording a marginal change (Table 5). Indonesian Muntok white pepper was reported with an increase of 7% as compared to the previous month to an average of USD 4,737 per Mt. The increase of Indonesia white pepper could be contributed to the depleted stock in local market whilst stock was limited. In local currency, the price of Muntok white pepper was reported at an average of IDR 71,045 per Kg from IDR 62,263 per Kg in February. Farm gate price of Malaysia white pepper was reported stable at an average of USD 3,946 per Mt. Furthermore, Viet Nam white pepper was reported with significant increase of 41% when compared to the previous month, averaging at USD 4,384 per Mt. In local currency, the price of Viet Nam white pepper was reported at an average of VND 105,543 per Kg, an increase of VND 31,043 per Kg when compared to the previous month. China white pepper was reported with an increase of 13% as compared to February and was traded at an average of USD 5,520 per Mt in domestic market. The increase of China's pepper could be contributed to the increasing demand from China inland market whilst stock was limited. Furthermore, the cold weather in the beginning of 2021 had affected growth of pepper in China which estimated to result in decrease of production this year.
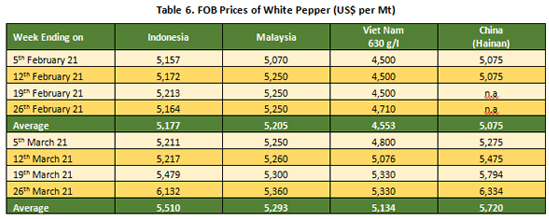
Similar to local market, FOB price of white pepper showed a positive outlook. FOB price of Indonesian white pepper in March 2021 was reported with an increase of 6% when compared to the previous month, averaging at USD 5,510 per Mt. FOB price of Malaysian white pepper was also reported with an increase of 2% when compared to February and was traded at an average of USD 5,293 per Mt. Furthermore, FOB price of Viet Nam white pepper was reported with an increase of 13% when compared to the previous month at an average of USD 5,134 per Mt. China white pepper was also reported with an increase of 13% when compared to February and was traded at an average of USD 5,720 per Mt internationally (Table 6).
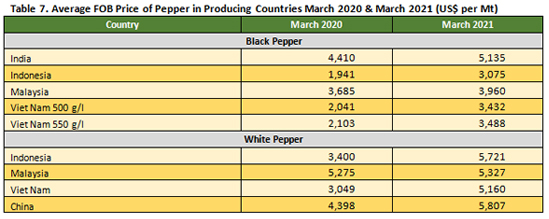
Entering the second year and 3rd months of the global pandemic, FOB price of peppers in comparison between March 2020 and March 2021 showed an increasing trend. India black pepper in March 2021 was reported with an increase of 16% as compared to the same period in 2020 to an average of USD 5,135 per Mt. Indonesia black and white pepper were reported with an increase of 58% and 68% respectively as compared to March 2020, averaging at USD 3,075 per Mt for black pepper and USD 5,721 per Mt for white pepper. Malaysia black and white pepper were reported with an increase of 7% and 1% respectively as compared to March 2020, averaging at USD 3,960 per Mt and USD 5,327 Mt respectively. Furthermore, Viet Nam black pepper 500 g/l, 550 g/l and Viet Nam white pepper were reported with an increase of 68%, 66% and 69% respectively as opposed to the same period in 2020 to an average of USD 3,432 per Mt, USD 3,488 per Mt and USD 5,160 per Mt respectively. FOB price of China white pepper was reported with an increase of 32% when compared to March 2020 and was traded at an average of USD 5,807 per Mt (Table 7).
Highlight on World Pepper Export and Import of Producing and Consuming Countries as of the 2nd Semester 2020.
World Pepper Export as of the 2nd Semester 2020
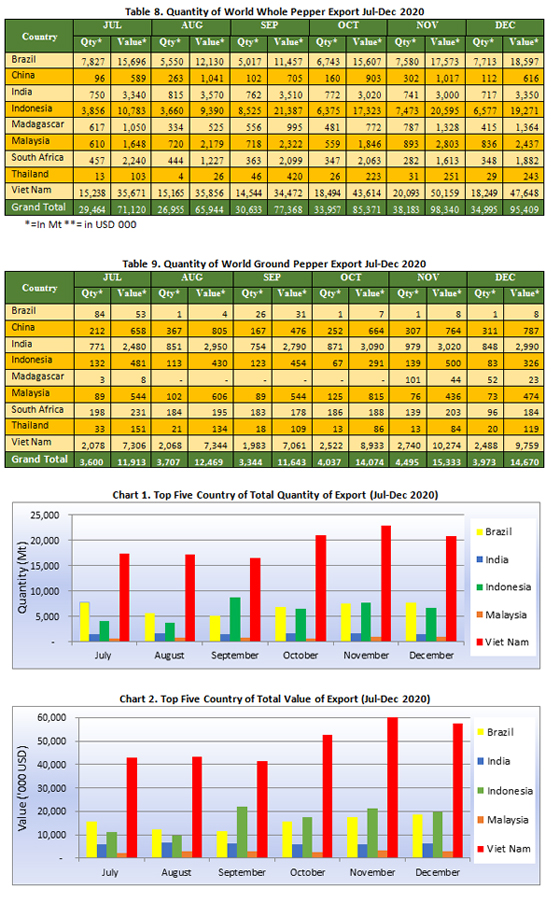
World pepper export of pepper producing origins as of July-December 2020 fluctuated with a total of 217,341 Mt. Thus, recording a 14% decrease when compared to the 1st semester of 2020 which amounted to 252,952 Mt (read Market Report September 2020 edition). The highest export of the 2nd semester 2020 was reported in November 2020 with a total of 42,678 Mt whilst the lowest export occurred in August which only reached 30,662 Mt. Comparing July to December 2020 pepper export from pepper producing origins recorded an increase of 18% totaling at 38,968 Mt (Table 8) in December. As for the 2nd semester of 2020 the top three pepper exporters were Viet Nam with 115,662 Mt or 53% of the world export share of pepper origins for the 2nd semester of 2020, followed by Brazil with 40,544 Mt (19%) and Indonesia with 37,123 Mt (17%).
Viet Nam
During the 2nd semester of 2020, Viet Nam was reported to have exported a total of 115,662 Mt which calculated to 88% or 101,783 Mt of whole pepper and 12% or 13,879 Mt of ground pepper. Thus, recording a staggering 31% decrease when compared with the achievement of the 1st semester. Pepper export from Viet Nam during the 2nd semester 2020 fluctuated with an average export of pepper amounted to 19,277 Mt per month with the highest export was reported in November with 22,833 Mt while the lowest export occurred in September with 16,527 Mt. The highest increase of pepper export by Viet Nam was reported to have occurred in October with an increase of 27% or 4,489 Mt as compared with the previous month. In December 2020, Viet Nam exported a total of 20,737 Mt, thus recording an increase of 20% or 3,421 Mt as compared with July. As for the 2nd semester 2020, Viet Nam's total revenue from pepper export was reported to be as high as USD 298.0 Million, recording a 16% deficit when compared to the 1st semester of 2020.
Furthermore, during the 2nd semester of 2020, Viet Nam's top 5 Country destinations for its pepper were reported to be United States of America with 26,222 Mt (a decrease of 7% when compared with the 1st semester of 2020), China with 19,876 Mt (a decrease of 45%) (many cross border and undocumented trade), United Arab Emirates with 7,031 Mt (an increase of 17%), Germany with 4,352 Mt (a decrease of 33%) and Ireland with 3,998 Mt (an increase of 3,039 Mt).
Brazil
In the 2nd semester of 2020, Brazil was reported to have exported a total of 40,544 Mt which comprised of 99.7% or 40,430 Mt of whole pepper and 0.3% or 114 Mt of ground pepper, recording an 18% decrease when compared to the 1st semester of 2020. Pepper export from Brazil during the 2nd semester 2020 fluctuated with an increasing trend, averaging at 6,757 per Mt month of which the highest export was reported in July with 7,911 Mt while the lowest export occurred in September with 5,043 Mt. The highest increase of pepper export by Brazil occurred in October with an increase of 34% or 1,701 Mt as compared with the previous month. In December 2020, Brazil exported a total of 7,714 Mt, thus recording a decrease of 2% or 198 Mt when compared with July 2020. As for the 2nd semester of 2020, Brazil's total revenue from pepper export was reported to be as high as USD 91.1 Million. Thus, recording a 3% deficit as compared to the 1st semester of 2020.
Furthermore, during the 2nd semester of 2020, Brazil's top 5 Country destinations for its pepper were reported to be Germany with 7,998 Mt (an increase by 51% when compared with the 1st semester of 2020), Viet Nam with 7,071 Mt (an increase of 39%), United States of America with 5,233 Mt (a decrease of 23%), India with 2,442 Mt (an increase of 35%) and Egypt with 2,387 Mt (a decrease of 45%).
Indonesia
During the 2nd semester of 2020, Indonesia was reported to have exported a total of 37,123 Mt which comprised of 98% or 36,466 Mt of whole pepper and 2% or 657 Mt of ground pepper. Thus, recording a significant increase of 75% when compared with the 1st semester of 2020. Pepper export from Indonesia during the 2nd semester 2020 fluctuated, averaging to 6,187 Mt per month of which the highest export was reported in September with 8,648 Mt while the lowest export occurred in August with 3,772 Mt. The high figure of Indonesia pepper export in September could be contributed that Indonesia's harvest of pepper occurs during August-October. The highest increase of pepper export by Indonesia also occurred in September with an increase of 129% or 4,876 Mt as compared with the previous month. In December 2020, Indonesia exported a total of 6,660 Mt, thus recording an increase of 67% or 2,672 Mt as compared with July 2020. As for the 2nd semester 2020, Indonesia's total revenue from pepper export was reported to be as high as USD 101.2 Million, recording a significant increase of 71% when compared with the 1st semester of 2020.
Furthermore, in the 2nd semester of 2020, Indonesia's top 5 Country destinations for its pepper were reported to be Viet Nam with 15,717 Mt (an increase of 10,369 Mt when compared with the 1st semester of 2020), China with 6,232 Mt (an increase by 22%), United States of America with 3,763 Mt (an increase of 31%), India with 3,315 Mt (an increase of 92%) and Germany with 1,371 Mt (an increase by 945 Mt).
India
In the 2nd semester 2020, India was reported to have exported a total of 9,631 Mt which comprised of 47% or 4,557 Mt of whole pepper and 53% or 5,074 Mt of ground pepper, recording an increase of 23% when compared with the 1st semester of 2020. Pepper export from India during the 2nd semester of 2020 fluctuated, averaging at 1,605 Mt per month with the highest export was reported in November with 1,720 Mt while the lowest export occurred in September with 1,516 Mt. The highest increase of pepper export by India occurred in August with an increase of 10% or 145 Mt as compared with the previous month. In December 2020, India exported a total of 1,565 Mt, thus recording an increase of 3% or 44 Mt as compared with July 2020. As for the 2nd semester 2020, India's total revenue from pepper export was reported to be as high as USD 37.1 Million. Thus, recording an increase of 28% when compared with the 1st semester 2020.
Furthermore, during the 2nd semester of 2020, India's top 5 Country destinations for its pepper were reported to be United States of America with 3,384 Mt (an increase of 60% when compared with the 1st semester of 2020), Canada with 654 Mt (an increase of 37%), United Kingdom with 616 Mt (a decrease of 6%), Sweden with 562 Mt (an increase of 42%) and Spain with 553 Mt (an increase of 51%).
Malaysia
During the 2nd semester of 2020, Malaysia was reported to have exported a total of 4,890 Mt which comprised of 89% or 4,336 Mt of whole pepper and 11% or 554 Mt of ground pepper. Thus, recording a significant increase of 35% when compared with the 1st semester of 2020. Pepper export from Malaysia during the 2nd semester 2020 fluctuated, averaging at 815 Mt per month with the highest export was reported in November with 969 Mt while the lowest export occurred in October with 684 Mt. The highest increase of pepper export by Malaysia occurred in November with an increase by 42% or 285 Mt as compared with the previous month. In December 2020, Malaysia exported a total of 909 Mt, thus recording an increase of 30% or 210 Mt when compared with July 2020. As for the 2nd semester 2020, Malaysia's total revenue from pepper export was reported to be as high as USD 16.6 Million, recording a 34% increase when compared with the 1st semester of 2020.
In addition, in the 2nd semester of 2020, Malaysia's top 5 Country destinations for its pepper were reported to be Japan with 1,670 Mt (an increase of 12% when compared with the 1st semester of 2020), China with 826 Mt (an increase of 18%), Viet Nam with 690 Mt (an increase by 470 Mt), Taiwan with 561 Mt (an increase of 76%) and Singapore with 330 Mt (an increase by 14%).
Madagascar
During the 2nd semester of 2020, Madagascar was reported to have exported a total of 3,346 Mt which comprised of 95% or 3,190 Mt of whole pepper and 5% or 156 Mt of ground pepper. Thus, recording an increase by 2,113 Mt when compared with the 1st semester of 2020. Pepper export from Madagascar during the 2nd semester 2020 fluctuated, averaging at Mt 558 Mt per month with the highest export was reported in November with 888 Mt while the lowest export occurred in August with 334 Mt. The highest increase of pepper export by Madagascar occurred in November with an increase by 85% or 407 Mt as compared with the previous month. In December 2020, Madagascar exported a total of 467 Mt, thus recording a decrease of 25% or 153 Mt as compared with July 2020. As for the 2nd semester 2020, Madagascar's total revenue from pepper export was reported to be as high as USD 6.1 Million, recording a total increase by USD 3.5 Million when compared with the 1st semester 2020.
Furthermore, in the 2nd semester of 2020, Madagascar's top 5 Country destinations for its pepper were reported to be Pakistan with 532 Mt (an increase by 506 Mt when compared with the 1st semester 2020), United Arab Emirates with 440 Mt (an increase of 304 Mt), India with 418 Mt (an increase by 376 Mt), Egypt with 276 Mt (an increase by 262 Mt) and France with 215 Mt (an increase of 24%).
South Africa
During the 2nd semester of 2020, South Africa was reported to have exported a total of 3,227 Mt which comprised of 69% or 2,241 Mt of whole pepper and 31% or 986 Mt of ground pepper. Thus, recording an increase of 1,718 Mt when compared with the 1st semester of 2020. Pepper export from South Africa during the 2nd semester 2020 fluctuated, averaging at 538 Mt per month with the highest export was reported in July with 655 Mt while the lowest export occurred in November with 421 Mt. The only increase of pepper export by South Africa occurred in December with an increase by 5% or 23 Mt as compared with the previous month. In December 2020, South Africa exported a total of 444 Mt, thus recording a decrease by 32% or 211 Mt when compared with July 2020. As for the 2nd semester 2020, South Africa's total revenue from pepper export was reported to be as high as USD 12.3 Million, recording a significant increase of 87% when compared with the 1st semester of 2020.
In addition, in the 2nd semester of 2020, South Africa's top 5 Country destinations for its pepper were reported to be Botswana with 848 Mt (an increase of 571 Mt when compared with the 1st semester of 2020), United States of America with 645 Mt (an increase of 58%), Australia with 382 Mt (an increase by 72%), Japan with 361 Mt (an increase of 181 Mt) and United Kingdom with 230 Mt (an increase of 185 Mt).
China (Mirror Data)
In the 2nd semester of 2020, China was reported to have exported a total of 2,651 Mt which comprised of 39% or 1,035 Mt of whole pepper and 61% or 1,616 Mt of ground pepper, recording an increase of 1,675 Mt when compared with the 1st semester of 2020. Pepper export from China during the 2nd semester 2020 fluctuated, averaging at 442 Mt per month with the highest export recorded in August with 630 Mt while the lowest export occurred in September with 269 Mt. The high figure of China pepper export in August could be contributed to the high stock following the end of harvest in July. The highest increase of pepper export by China also occurred in August with an increase by 322 Mt as compared with the previous month. In December 2020, China exported a total of 423 Mt, thus recording an increase by 37% or 115 Mt as compared with July 2020. As for the 2nd semester 220, China's total revenue from pepper export was reported to be as high as USD 9.0 Million. Thus, recording a significant increase of 87% as compared with the 1st semester of 2020.
Furthermore, in the 2nd semester of 2020, China's top 5 Country destinations for its pepper were reported to be Malaysia with 355 Mt (an increase by 346 Mt when compared with the 1st semester of 2020), United Kingdom with 292 Mt (an increase of 237 Mt), United States of America with 291 Mt (an increase of 191 Mt), Chile with 269 Mt (an increase of 266 Mt) and South Africa with 158 Mt (1st semester 2020 n.a).
Thailand
In the 2nd semester of 2020, Thailand was reported to have exported a total of 267 Mt which comprised of 56% or 149 Mt of whole pepper and 44% or 118 Mt of ground pepper, recording a 43% decrease as compared with the 1st semester of 2020. Pepper export from Thailand during the 2nd semester 2020 fluctuated with an increasing trend, averaging at 45 Mt per month with the highest export was reported in September with 64 Mt while the lowest export occurred in August with 25 Mt. The highest increase of pepper export by Thailand occurred in September with an increase of 39 Mt as compared with the previous month. In December 2020, Thailand exported a total of 49 Mt, thus recording an increase of 7% or 3 Mt as compared with July 2020. As for the 2nd semester 2020, Thailand's total revenue from pepper export was reported to be as high as USD 1.9 Million, recording a loss by 27% as compared with the 1st semester of 2020.
Furthermore, in the 2nd semester of 2020, Thailand's top 5 Country destinations for its pepper were reported to be South Africa with 91 Mt (a decrease of 28% when compared with the 1st semester of 2020), United States of America with 47 Mt (a decrease of 23%), Cambodia with 14 Mt (an increase of 13 Mt), Myanmar with 13 Mt (a decrease of 92%) and New Zealand with 13 Mt (an increase of 21%).
World Pepper Import of the 2nd Semester 2020
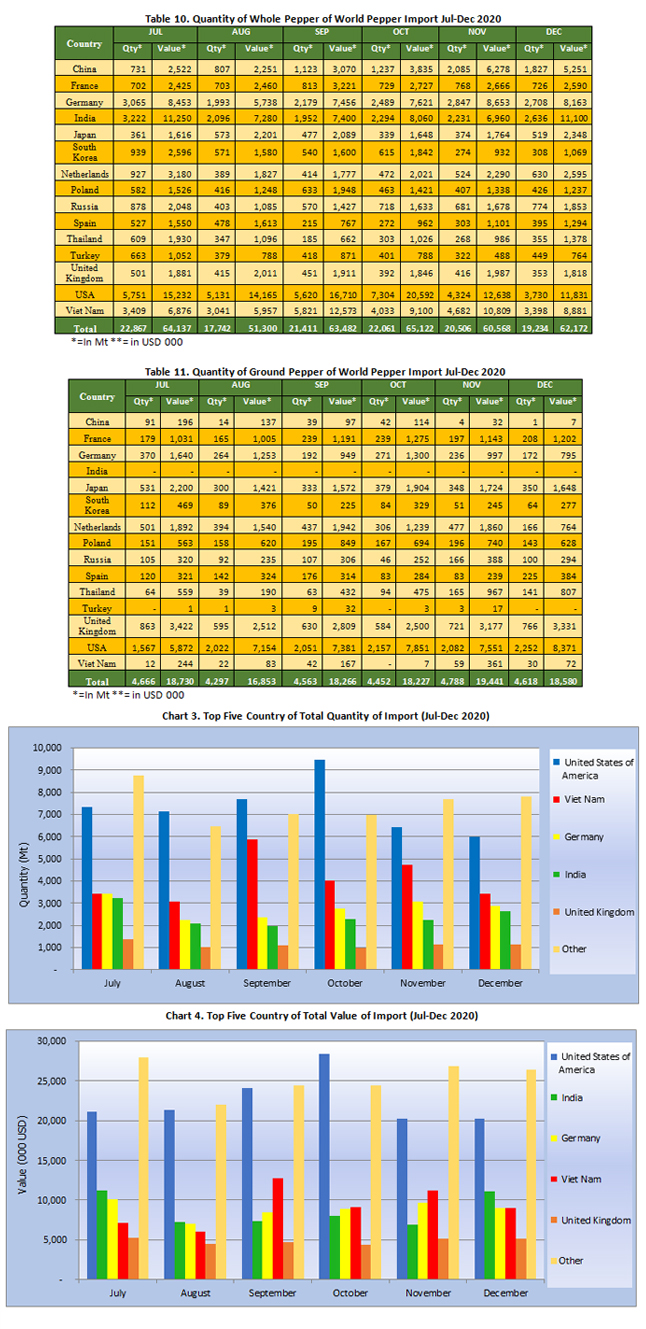
World pepper import of major consuming countries during the 2nd semester of 2020 fluctuated with a total of 151,206 Mt, recording an 11% increase when compared with the 1st semester of 2020. The highest import was reported in July 2020 with 27,533 Mt whilst the lowest import occurred in August with only 22,039 Mt. Comparing July to December 2020 pepper import from major pepper consuming countries recorded a decrease by 13% totaling at 23,852 Mt (Table 10) in December. During the 2nd semester of 2020, the top five pepper importer were United States of America with 43,991 Mt or 29% of the world import share of pepper destinations, followed by Viet Nam with 24,549 Mt (16%), Germany with 16,786 Mt (11%), India with 14,431 Mt (10%) and United Kingdom with 6,687 Mt (4.4%). However, based on mirror data taken from China counterpart, as for the 2nd semester of 2020 China had imported a total of 19,876 Mt which would make China the 3rd biggest pepper importer for the 2nd semester of 2020 with 13% of the world import share of pepper destinations.
United States of America
In the 2nd semester of 2020, United States of America was reported to have imported a total of 43,991 Mt which comprised of 72% or 31,860 Mt of whole pepper and 28% or 12,131 Mt of ground pepper. Thus, recording a 3% increase when compared with the 1st semester of 2020. Pepper imported by United States of America during the 2nd semester 2020 fluctuated with a decreasing trend, averaging at 7,332 Mt per month with the highest import was reported in October with 9,461 Mt while the lowest occurred in December with 5,982 Mt. The highest increase of pepper import by United States of America occurred in October with an increase by 23% or 1,790 Mt as compared with the previous month. In December 2020, United States of America imported a total of 5,982 Mt, thus recording a decrease of 18% or 1,336 Mt as compared with July 2020. As for the 2nd semester of 2020, United States of America's total expenditure of pepper import was reported to be as high as USD 135.3 Million, spending 10% more when compared with the 1st semester of 2020.
Furthermore, during the 2nd semester of 2020, United States of America's top 5 origin countries for its pepper were reported to be Viet Nam with 29,680 Mt (an increase of 6% when compared with the 1st semester of 2020), Brazil with 6,366 Mt (a decrease of 21%), Indonesia with 3,179 Mt (an increase of 6%), India with 2,893 Mt (an increase of 39%) and Ecuador with 612 Mt (an increase by 348 Mt).
Viet Nam (Mirror Data)
During the 2nd semester of 2020, Viet Nam was reported to have imported a total of 24,549 Mt which comprised of 99.3% or 24,384 Mt of whole pepper and 0.7% or 165 Mt of ground pepper, recording an increase of 13,709 Mt when compared with the 1st semester of 2020. Pepper imported by Viet Nam during the 2nd semester 2020 fluctuated averaging at 4,092 Mt per month with the highest import was reported in September 2020 with 5,863 Mt while the lowest import occurred in August with 3,063 Mt. The highest increase of pepper import by Viet Nam occurred in September with a significant increase by 91% or 2,800 Mt as compared with the previous month. In December 2020, Viet Nam imported a total of 3,428 Mt, recording a slight increase of 0.2% or 7 Mt as compared with July 2020. As for the 2nd semester of 2020, Viet Nam's total expenditure of pepper import was as high as USD 55.1 Million, spending USD 31.6 Million more when compared with the 1st semester of 2020.
Furthermore, in the 2nd semester of 2020, Viet Nam's top 5 origin countries for its pepper were reported to be Indonesia with 15,717 Mt (an increase of 10,369 Mt as compared with the 1st semester of 2020), Brazil with 7,072 Mt (an increase of 39%), Malaysia with 690 Mt (an increase of 470 Mt), Cambodia with 611 Mt (1st semester of 2020 n.a) and Singapore with 127 Mt (an increase of 72 Mt).
Germany
During the 2nd semester of 2020, Germany was reported to have imported a total of 16,786 Mt which comprised of 91% or 15,281 Mt of whole pepper and 9% or 1,505 Mt of ground pepper. Thus, recording a spike of 7% as opposed to the 1st semester of 2020. Pepper imported by Germany during the2nd semester of 2020 fluctuated, averaging at 2,798 Mt per month with the highest import was reported in July with 3,435 Mt while the lowest import occurred in August with 2,257 Mt. The highest increase of pepper import by Germany occurred in October with an increase by 16% or 389 Mt as compared with the previous month. In December 2020, Germany imported a total of 2,880 Mt, recording a decrease of 16% or 555 Mt as compared to July 2020. As for the 2nd semester of 2020, Germany's total expenditure of pepper import was reported to be as high as USD 53.0 Million, spending 18% more when compared to the 1st semester of 2020.
Furthermore, during the 2nd semester of 2020, Germany's top 5 origin countries for its pepper were reported to be Brazil with 7,592 Mt (an increase of 17% when compared with the 1st semester of 2020), Viet Nam with 5,611 Mt (a decrease of 15%), Indonesia with 1,208 Mt (an increase of 47%), Cambodia with 790 Mt (an increase by 436 Mt) and India with 499 Mt (a decrease of 9%).
India
During the 2nd semester of 2020, India was reported to have imported a total of 14,431 Mt with all import was whole pepper, recording an increase of 11% when compared with the 1st semester of 2020. Pepper imported by India during the 2nd semester 2020 fluctuated, averaging at 2,405 Mt per month with the highest import was reported in July with 3,222 Mt while the lowest import occurred in September with 1,952 Mt. The highest increase of pepper import by India occurred in December with an increase of 18% or 405 Mt as compared with the previous month. In December 2020, India imported a total of 2,636 Mt, recording a decrease of 18% or 586 Mt as compared with July 2020. As for the 2nd semester of 2020, India's total expenditure of pepper import was reported to be as high as USD 52.0 Million, recording a significant increase of 55% when compared to the 1st semester of 2020.
Furthermore, in the 2nd semester of 2020, India's top 5 origin countries for its pepper were reported to be Sri Lanka with 4,457 Mt (an increase of 2,869 Mt as compared with the 1st semester of 2020), Viet Nam with 4,063 Mt (a decrease by 35%), Indonesia with 2,973 Mt (an increase of 71%), Brazil with 1,569 Mt (a drop of 44%) and Ecuador with 560 Mt (an increase of 39%).
United Kingdom
During the 2nd semester of 2020, United Kingdom was reported to have imported a total of 6,687 Mt which comprised of 38% or 2,528 Mt of whole pepper and 62% or 4,159 Mt of ground pepper. Thus, recording a drop of 1% when compared with the 1st semester of 2020. Pepper imported by United Kingdom during the 2nd semester 2020 fluctuated, averaging at 1,115 Mt per month with the highest import was reported in July with 1,364 Mt while the lowest import occurred in October with 976 Mt. The highest increase of pepper import by United Kingdom occurred in November with an increase by 16% or 161 Mt as compared with the previous month. In December 2020, United Kingdom imported a total of 1,119 Mt, recording a decrease of 18% or 245 Mt as compared with July 2020. As for the 2nd semester 2020, United Kingdom's total expenditure of pepper import was reported to be as high as USD 29.2 Million, spending 3% more as compared to the 1st semester of 2020.
Furthermore, in the 2nd semester of 2020, United Kingdom' top 5 origin countries for its pepper were reported to be Viet Nam with 2,455 Mt (a decrease of 18% as compared to the 1st semester of 2020), Netherlands with 1,499 Mt (an increase of 7%), India with 643 Mt (a decrease of 1%), France with 486 Mt (an increase of 12%) and Spain with 310 Mt (an increase of 7%).
China (Mirror Data)
During the 2nd semester of 2020, China was reported to have imported a total of 19,876 Mt, recording a drop by 52% when compared with the 1st semester of 2020 which was reported at 41,155 Mt. All of China's pepper were reported to come from Viet Nam. Thus, recording a decrease of 45% of China import from Viet Nam as compared to the 1st semester of 2020 which was reported at 36,174 Mt.
Source:
• Brazil, Unofficial source (Coreimex, CSG Trade)
• India: AISEF, NCDEX, Indian Chamber of Commerce & Industry
• Indonesia: Unofficial source
• Sri Lanka: Sri Lankan Pepper Board
• Sri Lanka: Department of Export Agriculture
• Viet Nam : Viet Nam Pepper Association, HCMC
• China: Hainan Pepper Association, China Spice Association
• International Trade Centre (ITC) - Geneva
Note: Some of the data in this publication are from the IPC database. The data are obtained from official reports and correspondence between the IPC and have been processed based on statistical norms that can be accounted for.
Previous Publications
- MARKET REVIEW - September 2019
- MARKET REVIEW - August 2019
- MARKET REVIEW - July 2019
- MARKET REVIEW - June 2019
- MARKET REVIEW - May 2019
- MARKET REVIEW - April 2019
- MARKET REVIEW - March 2019
- MARKET REVIEW - February 2019
- MARKET REVIEW - January 2019
- Market Review - December 2018
- Market Review - November 2018
- Market Review - October 2018
- Market Review - September 2018
- Market Review - August 2018
- Market Review - July 2018
- Market Review - June 2018
- Market Review - May 2018
- Market Review - April 2018
- Market Review - March 2018
- Market Review - February 2017
- Market Review - January 2017
- Market Review - December 2017
- Market Review - November 2017
- Market Review - October 2017
- Market Review - September 2017