a UNESCAP Intergovermental Organization
a UNESCAP Intergovermental Organization
Monthly Publication
MARKET REVIEW - February 2020
PRICE HISTORY
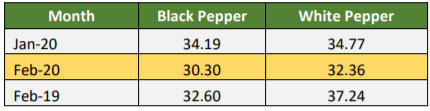
As the outbreak of Corona Virus continued affecting around 109 countries all over the world with a death toll reaching 3,831 cases (as of 09 March), pepper price index for the 2th month of 2020 was reported with a negative outlook. The price index of black pepper for February was reported with a major decrease of 11.4% as compared with the previous month at 30.30 point (Table 1). In addition, when compared with February 2019, the price index of black pepper experienced 7% loss. Following the same trend, the price index of white pepper for February 2020 was also reported with a significant decrease as it recorded a 6.9% decrease as compared with previous month at 32.36 point. In comparison with the same period in 2019, the price index of white pepper experienced a more significant decrease by 13%.
Table 1. IPC Price Index (Base price: Average 2011-2015)
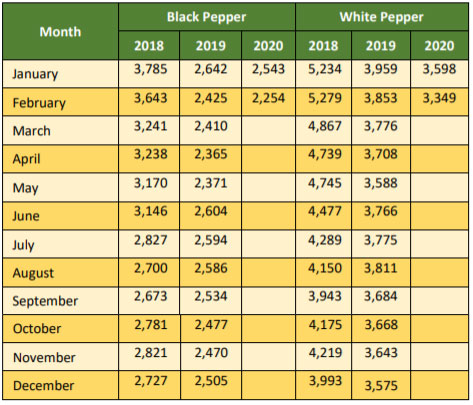
In the 2th month of 2020, the composite price for both black and white pepper was reported with a negative outlook. Composite price of black pepper in February was reported at USD 2,254 per Mt, recording USD 290 per Mt loss as compared with January. Aligned with composite price of black pepper, composite price of white pepper was also reported with a rather significant loss as it dropped to USD 3,349 per Mt. Thus, recording USD 249 per Mt loss as compared with the previous month.
Table 2. Composite Price of Black and White Pepper (US$/Mt)
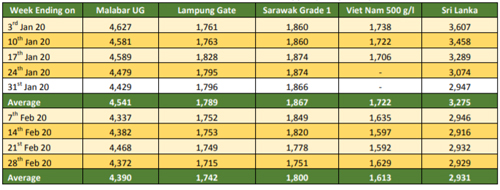
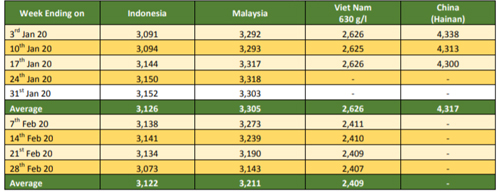
Pepper prices in the 2nd month of 2020, showed a negative outlook with Viet Nam origin recorded the highest decrease as opposed to the previous month. The farm gate price of black pepper in India was reported with a decrease by 3% as opposed to January, averaging at USD 4,390 per Mt (Table 3). In the local currency farm gate price of India black pepper was traded at an average of INR 313 per Kg. The decrease of India black pepper price could be contributed to the harvest season currently in full swing as well as the depreciation of Indian Rupee against US Dollar.
The price of black pepper in Indonesia (Lampung black pepper) was reported with a decrease by 3% as opposed to the previous month, averaging at of USD 1,742 per Mt. The decrease of Indonesia black pepper could be contributed to the sluggish demand and the weakening of Indonesia's local currency against the US Dollar (IDR 13,776 for USD 1). In local currency, the price of Indonesia black pepper decreased to an average of IDR 24,000 per Kg from IDR 24,614 per Kg
In February 2020, the farm gate price of Malaysia's black pepper was reported with a decrease by 4% as compared to the previous month, averaging at USD 1,800 per Mt. The decrease of Malaysia black pepper could be contributed to the decrease of pepper price in local currency and the weakening of Malaysia's local currency against the US Dollar (MYR 4.16 for USD 1) or a depreciation by 2% when compared with the January. In local currency, the price of Malaysia black pepper decreased to an average of MYR 7,490 per Kg from MYR 7,621 per Kg.
Furthermore, farm gate price of black pepper in Viet Nam was reported to have decreased by 6% as opposed to January averaging at USD 1,613 per Mt. The decrease of Viet Nam black pepper price could be contributed to the harvest season currently in full swing. In local currency, the price of Viet Nam black pepper decreased to an average of VND 38,500 per Kg from VND 40,875 per Kg.
Sri Lanka black pepper was reported with a staggering 11% deficit as opposed to January and was reported at an average of USD 2,931 per Mt. The decrease of Sri Lanka black pepper could be contributed to sufficient stock following end of harvest in January. In local currency, the price of Sri Lanka black pepper decreased to an average of LKR 531.92 per Kg from LKR 586.72 per Kg.
Table 3. Farm Gate Prices of Black Pepper (US$ per Mt)
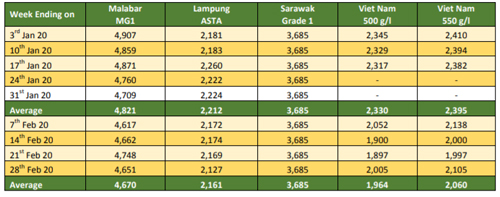
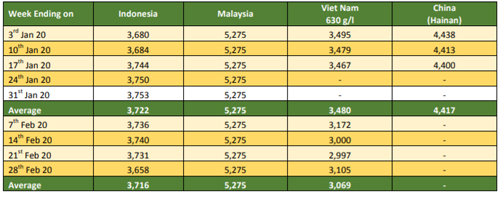
FOB price of black pepper for February 2020 also showed a negative outlook with only Malaysia origin was reported stable. India was reported with the same 3% decrease when compared to the January, averaging at USD 4,670 per Mt (Table 4). Furthermore, the FOB price of black pepper in Indonesia was also reported with a decrease by 2% as opposed to January, averaging at USD 2,161 per Mt. FOB price of Malaysian black pepper was reported stable at an average of USD 3,685 per Mt. Furthermore, FOB price of Viet Nam black pepper 500 g/l and 550 g/l were reported with a significant decrease by 16% and 14% respectively as compared to the previous month at an average of USD 1,964 per Mt and USD 2,060 per Mt respectively.
Table 4. FOB Prices of Black Pepper (US$ per Mt)
Farm gate prices of white pepper in February 2020 also showed a negative outlook (Table 5) as only Indonesia origin was reported stable. Indonesia Muntok white pepper was reported stable at average of USD 3,122 per Mt. In local currency, the price of Muntok white pepper was reported at an average of IDR 43,000 per Kg. Farm gate price of Malaysia white pepper was reported with a decrease by 3% as opposed to January at an average of USD 3,211 per Mt. Furthermore, Viet Nam white pepper was reported with a significant decrease by 8% when compare to the previous month, averaging at USD 2,409 per Mt. China market continued to be reported inactive in February as no business took place due to the outbreak of Corona Virus.
Table 5. Farm Gate Prices of White Pepper (US$ per Mt)
FOB price of white pepper showed a rather stable outlook with only Viet Nam origin was reported with a decrease. FOB price of Indonesia white pepper for February 2020 was reported stable, averaging at USD 3,716 per Mt. Furthermore, FOB price of Malaysia white pepper continued to be reported stable and unchanged. Whilst, FOB price of Viet Nam white pepper was reported with a significant dropped of 12% at an average of USD 3,069 per Mt (Table 6).
Table 6. FOB Prices of White Pepper (US$ per Mt)
HIGHLIGHT ON BRAZIL
Production and Productivity
Brazil, known as one of the major pepper producing countries which is famous for its Black Pepper, is known to have a more competitive price as opposed to other origins. In recent year, Brazil has also surpassed Indonesia as the second largest pepper producer in the world with estimated quantity of 80,000 Mt in 2019. Brazil's increase of production could be contributed to the output of the first harvest of new plantation planted in 2017.
During 2008-2020 the area under pepper cultivation in Brazil had fluctuated. Between 2008-2013, area under pepper cultivation in Brazil saw a decrease by 37% to a total of 18,472 Ha from 29,549 Ha in 2008. The area under pepper cultivation in Brazil saw an increasing trend during 2013-2018 with an increase of 65% to a total of 30,503 Ha. In the course of 11 years between 2008-2018 total area under pepper cultivation in Brazil recorded an increase by 3% (Table 7). Furthermore, in 2019 the area under pepper cultivation in Brazil was estimated to increase by 2% as compared to 2018 to a total of 31,040 Ha. Whilst, for the year 2020 the area of pepper cultivation was projected to decrease by 1% as compared to 2019. The decrease of area under pepper cultivation in Brazil could be contributed to farmers in the last two years have stopped expanding new plantation in Para Region and Espirito Santos Region which are the main producer of pepper in Brazil.
Brazil production of pepper during 2008-2020 was reported fluctuating with a rather positive trend. In the course 11 years since 2008 pepper production in Brazil was reported to have recorded an increase of 76% as it recorded a total of 72,000 Mt in 2018 which comprised of 68,500 Mt of black pepper and 3,500 Mt of white pepper. The highest production of Brazil pepper In the course of 11 years between 2008-2018 was reported in 2018 with 72,000 Mt whilst the lowest production occurred in 2012 with 32,000 Mt. However, in the year 2019 production of Brazil pepper was estimated to increase by 11% when compared with 2018 to a total of 80,000 Mt which comprised of 76,000 Mt of black pepper and 4,000 Mt of white pepper. Furthermore, in relation to the decrease of the area under pepper cultivation as well as the lack of care for pepper plantation by farmers, in 2020 Brazilian pepper production was projected to decrease by 3% when compared to 2019 to a total of 78,000 Mt.
Table 7. Area under Pepper Cultivation and Pepper Production in Brazil
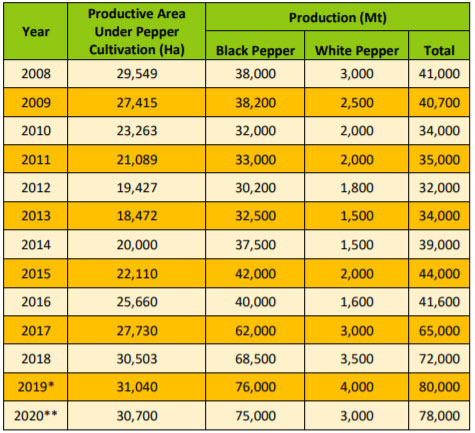
Note: *Figures are estimate ** Figures are Projection
Pepper productivity in Brazil In the course of 13 years between 2008-2020 was reported to be fluctuated with a rather positive trend. During 2008-2020, the lowest pepper productivity in Brazil was reported in 2008 with 1,388 Kg per Ha while the highest productivity was reported in 2019 which was estimated at 2,577 Kg per Mt. The lowest decrease of pepper productivity in Brazil was reported to occur in 2016 as it recorded a 19% loss when compared with the previous year. Whilst the highest increase of pepper productivity was reported in 2017 which recorded a 45% increase as opposed to the previous year. For the year 2019, Brazil pepper productivity was estimated with an increase of 9% to 2,577 Kg per Ha whilst in 2020 Brazil pepper productivity was projected with a slight decrease by 1% to 2,541 Kg per Ha (Chart 1).
Chart 1
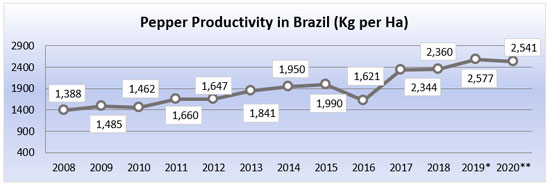
Note: *Figures are estimate ** Figures are Projection
Pepper Export from Brazil
Brazil, known as the second largest pepper producer in the world, had managed to take the second largest pepper exporter position from Indonesia in 2017. Since 2008 until 2019 there had been a significant increase of 131% or 48,091 Mt in the quantity of pepper export from Brazil which was mainly dominated with black pepper as it contributed to 94% of the total export figures (Table 8). The highest pepper export occurred in 2019 with 84,676 Mt whilst the lowest export occurred in 2012 with 29,129 Mt. In 2019, pepper export from Brazil was reported at 84,676 Mt, an increase by 17% as opposed to the previous year. Furthermore, as of February 2020, pepper export from Brazil was reported at 15,922 Mt which comprised of 15,285 Mt of black pepper and 637 Mt of white pepper, thus, recording a decrease of 8% as compared to the same period in 2019.
Table 8. Export of Pepper from Brazil 2008–2020*
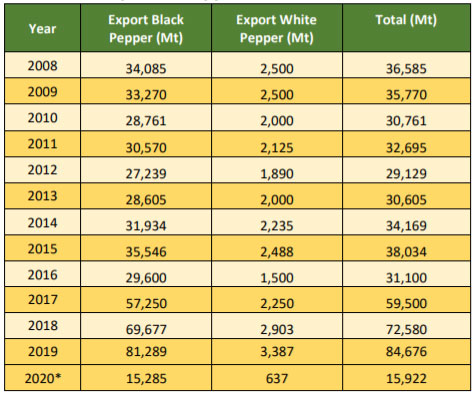
*As of February 2020
Chart 2
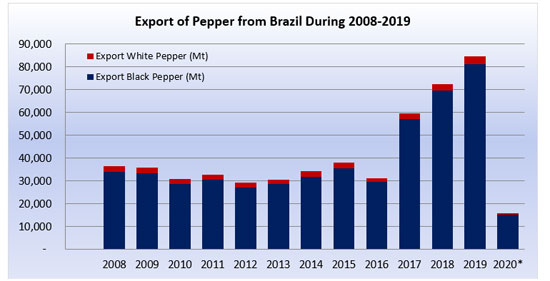
*As of February 2020
The number of pepper exports from Brazil had reportedly fluctuated in the last 14 months. The total export by Brazil in the past 14 months was reported at 100,597 Mt with total value as high as USD 210.4 Million. The average pepper export from Brazil was reported to be 7,186 Mt per month. The highest pepper export of Brazil occurred in October 2019 which reached 11,119 Mt whilst the lowest was reported in July 2019 with 3,046 Mt (Table 9). The high level of exports during that period (October) correlated closely to Brazil harvest season.
Table 9. Export Quantity and Value of Pepper from Brazil 2019-2020
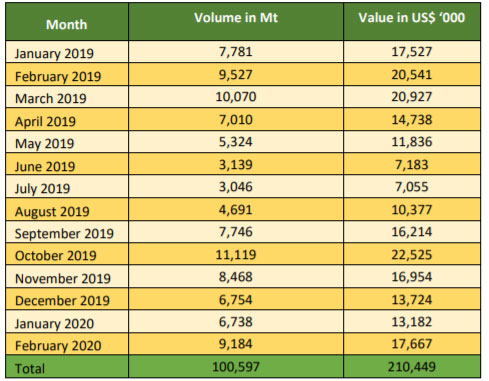
Source: Comexstat Brazil
Pepper from Brazil is exported to various countries in Asia, Europe, America and Africa (Table 10). During January 2019-February 2020, the top 10 country of destinations for Brazilian pepper were reported to be Viet Nam with 17,517 Mt (Contributed to 17% of the total pepper export during January 2019-February 2020), Germany with 13,127 Mt (13%), United States of America with 10,294 Mt (10%), Morocco with 7,817 Mt (8%), Egypt with 6,581 Mt (7%), India with 5,791 (6%), Mexico with 4,554 Mt (5%), Pakistan with 4,301 Mt (4%), United Arab Emirates with 3,779 Mt (4%) and France with 3,272 (3%).
Table 10. Top 10 Countries Destination Export Pepper from Brazil 2019-2020*
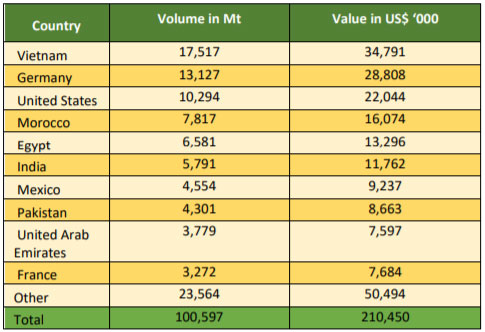
Source: Comexstat Brazil *As of February 2020
Pepper Export Price
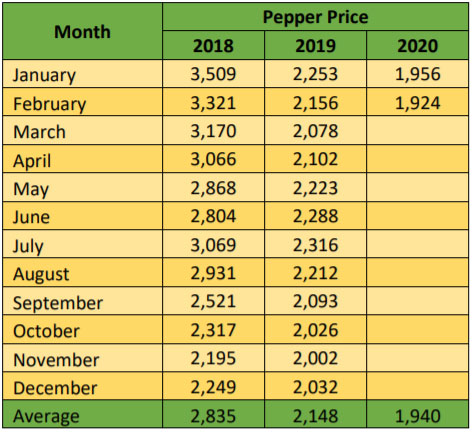
Brazil pepper export price had fluctuated significantly in the past three years which could be attributed to the world supply of pepper significantly exceeding the global demand. In 2018, the average pepper export price for Brazil was reported at USD 2,835 per Mt with the highest prices recorded in January with USD 3,509 per Mt whilst the lowest price was reported in November with USD 2,195 per Mt. In 2019, Brazilian average pepper export price was reported at USD 2,148 per Mt, recording a decreased of 24% as compared to 2018. In 2019, the highest average price was reported to have reached USD 2,316 per Mt (July 2019) whilst the lowest average price was reported in November with USD 2,002 per Mt. As of February 2020, the average pepper export price for Brazil was reported at USD 1,940 per Mt, recording a 12% decreased as compared to the same period in 2019 (Table 11).
Table 11. Monthly Export Pepper Price of Brazil
Source: Comexstat Brazil
Source:
- Brazil, Unofficial source (Coreimex, CSG Trade)
- India: AISEF, NCDEX, Indian Chamber of Commerce & Industry, Spices Board India
- Indonesia: Unofficial source
- Malaysia: Malaysian Pepper Board
- Sri Lanka: Department of Export Agriculture
- Viet Nam : Viet Nam Pepper Association, HCMC
- China: Hainan Pepper Association, China Spice Association
- Office of Agricultural Economics of Thailand
- A.A. SAYIA & Company
- International Trade Centre (ITC) - Geneva
Note: Some of the data in this publication are from the IPC database. The data are obtained from official reports and correspondence between the IPC and Sri Lanka and have been processed based on statistical norms that can be accounted for.
Previous Publications
- Market Review - August 2017
- Market Review - July 2017
- Market Review - June 2017
- Market Review - May 2017
- "Market Review - April 2017 "
- Market Review - March 2017
- Market Review - February 2017
- Market Review - January 2017
- Market Review - December 2016
- Market Review - November 2016
- Market Review - October 2016
- Market Review - September 2016
- Market Review - August 2016
- Market Review - July 2016
- Market Review - June 2016
- Market Review - May 2016
- Market Review - April 2016
- Market Review - March 2016
- Market Review - February 2016
- Market Review - January 2016
- Market Review - December 2015
- Market Review - November 2015
- Market Review - October 2015
- Market Review - September 2015
- Market Review - August 2015