a UNESCAP Intergovermental Organization
a UNESCAP Intergovermental Organization
Monthly Publication
MARKET REVIEW - September 2020
PRICE HISTORY
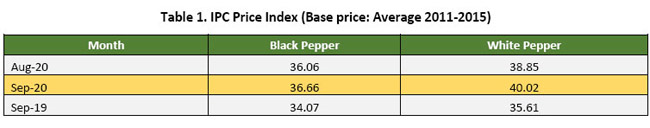
Continuing the positive trend from the previous month, the price index for September 2020 was reported on the positive side. The price index of black pepper was reported at 36.66 points, recording an increase by 1.7% when compared with August and an increase by 8% when compared with the same month in 2019. The price index of white pepper was reported with a higher increase of 3% when compared with August at 40.02 points (Table 1). When compared with the same period in 2019, a 12% increased was reported.
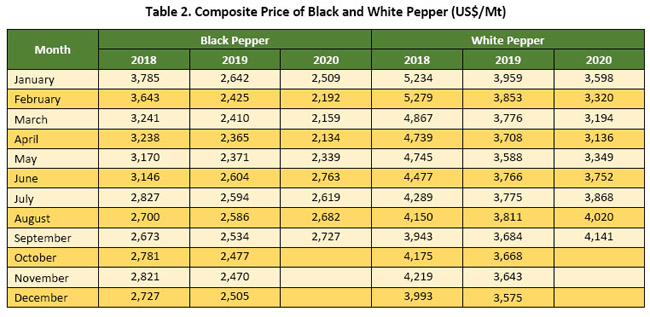
Following the increase of price index, the composite prices for September were reported with a positive outlook. Composite price of black pepper was reported with an increase by USD 45 per Mt as compared with the previous month at USD 2,727 per Mt (Table 2). Similarly, the composite price of white pepper was reported with an increase by USD 120 per Mt when compared with the previous month at USD 4,141 per Mt. thus recording the highest composite price of white pepper since 2019.
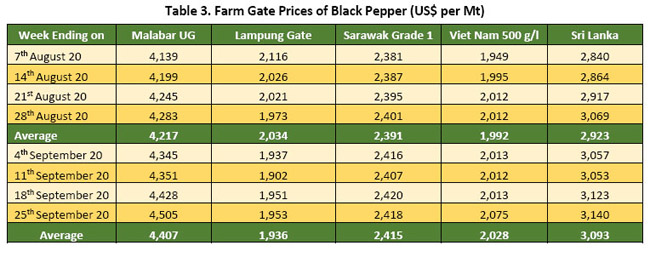
Pepper prices in the 9th month of 2020, showed a mixed response with a rather positive outlook as only Indonesia black pepper recorded a decrease. The farm gate price of black pepper in India was reported with an increase of 5% as opposed to August, averaging at USD 4,407 per Mt (Table 3). The increase of India black pepper could be contributed to the increase of demand as well as the appreciation by 2% of the India Rupee against US Dollar. In the local currency farm gate price of India black pepper was reported at an average of INR 324 per Kg, increasing from INR 315 per Kg in the previous month.
The price of black pepper in Indonesia (Lampung black pepper) was reported with a decrease by 5% as opposed to August 2020 as market sufficient of stock following the end of harvest, averaging at USD 1,936 per Mt. The price of Indonesia black pepper in local currency decreased to an average of IDR 28,739 per Kg from IDR 29,917 per Kg in August.
The farm gate price of Malaysia's black pepper for the 9th month of 2020 was reported with an increase of 1% when compared to the previous month averaging at USD 2,415 per Mt. The increase of Malaysia black pepper could be contributed to the appreciation by 1% of the Malaysian Ringgit against US Dollar. In local currency, the price of Malaysia black pepper was traded at an average of MYR 10,019 per Kg the same as the previous month.
Furthermore, farm gate price of black pepper in Viet Nam was reported with an increase of 2% as compared to the previous month, averaging at USD 2,028 per Mt. In local currency, the price of Viet Nam black pepper increased to an average of VND 48,463 per Kg from VND 47,548 per Kg in August.
The farm gate price of Sri Lankan black pepper was reported with a significant increase of 6% as opposed to August 2020 and was reported at an average of USD 3,093 per Mt. Sri Lanka black pepper in local currency increased to an average of LKR 574.71 per Kg from LKR 541.58 per Kg in August.
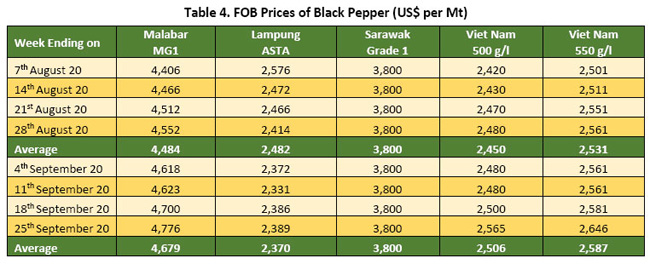
FOB price of black pepper for September 2020 continued the trend of the farm gate price with only Indonesia origin was reported with a decrease. India traded its Malabar black pepper internationally with an increase of USD 195 per Mt when compared to August, averaging at USD 4,679 per Mt (Table 4). Furthermore, the FOB price of Indonesian black pepper was reported with a decrease of 5% as opposed to August, averaging at USD 2,370 per Mt. FOB price of Malaysian black pepper was reported stable and unchanged. FOB price of Viet Nam black pepper 500 g/l and 550 g/l were reported with an increase of 2% respectively as compared to the previous month averaging at USD 2,506 per Mt and USD 2,587 per Mt respectively.
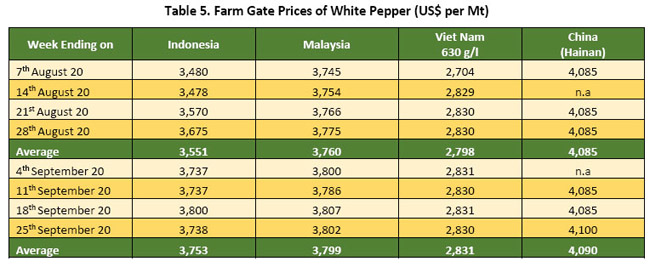
Farm gate prices of white pepper in September 2020 were reported with positive outlook (Table 5). Indonesia Muntok white pepper was reported with an increase of 6% as compared to the previous month to an average of USD 3,753 per Mt. In local currency, the price of Muntok white pepper was reported at an average of IDR 55,636 per Kg, an increase of IDR 3,219 per Kg when compared to the previous month. Contrary with black pepper, the increase of Indonesia white pepper could be contributed to the increase of demand while the stock was limited. Farm gate price of Malaysia white pepper was reported with an increase of 1% as opposed to August at an average of USD 3,799 per Mt. Furthermore, Viet Nam white pepper was reported with an increase of 1% when compared to the previous month, averaging at USD 2,831 per Mt. China white pepper was reported stable with a marginal increase and was traded at an average of USD 4,090 per Mt locally.
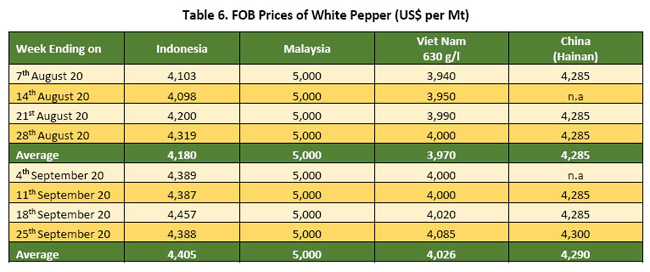
FOB price of white pepper also showed positive outlook, continuing the trend of the farm gate price. FOB price of Indonesia white pepper for September 2020 was reported with an increase of 5% when compared to August, averaging at USD 4,405 per Mt. FOB price of Malaysia white pepper was reported stable and unchanged. Furthermore, FOB price of Viet Nam white pepper was reported with an increase of 1% when compared to the previous month at an average of USD 4,026 per Mt. China white pepper was reported stable with a marginal increase and was traded at an average of USD 4,290 per Mt internationally (Table 6).
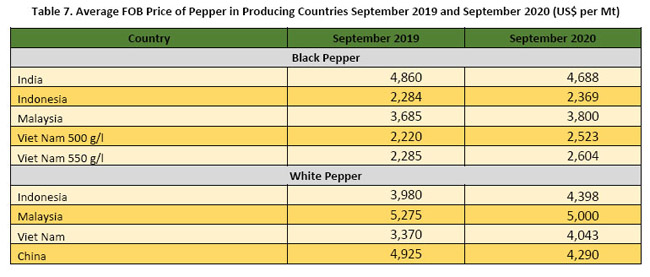
Entering the 9th month of global pandemic, FOB price of pepper in comparison between September 2019 and September 2020 fluctuated. India black pepper in September 2020 was reported with 4% deficit as compared to September 2019 at an average of USD 4,688 per Mt. Furthermore, Indonesia black and white pepper were reported with an increase of 4% and 11% respectively as compared to September 2019, averaging at USD 2,369 per Mt for black pepper and USD 4,398 per Mt for white pepper. Malaysia black pepper was reported with an increase of 3% as compared to September 2019, averaging at USD 3,800 per Mt. Whilst Malaysia white pepper was reported with 5% deficit as compared to the same period in 2019 to an average of USD 5,000 per Mt. Furthermore, Viet Nam black pepper 500 g/l, 550 g/l and Viet Nam white pepper were reported with an increase of 14%, 14% and 20% respectively as opposed to the same period in 2019 to an average of USD 2,523 per Mt, USD 2,604 per Mt and USD 4,043 per Mt respectively. China white pepper was reported with 13% deficit when compared to September 2019 and was traded at an average of USD 4,290 per Mt (Table 7).
Highlight on World Pepper Export and Import of Producing and Consuming Countries as of the 1st Semester 2020.
World Pepper Export as of the 1st Semester 2020
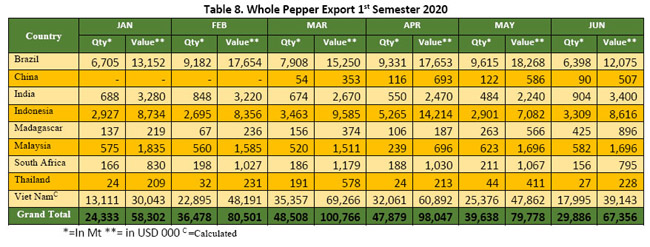
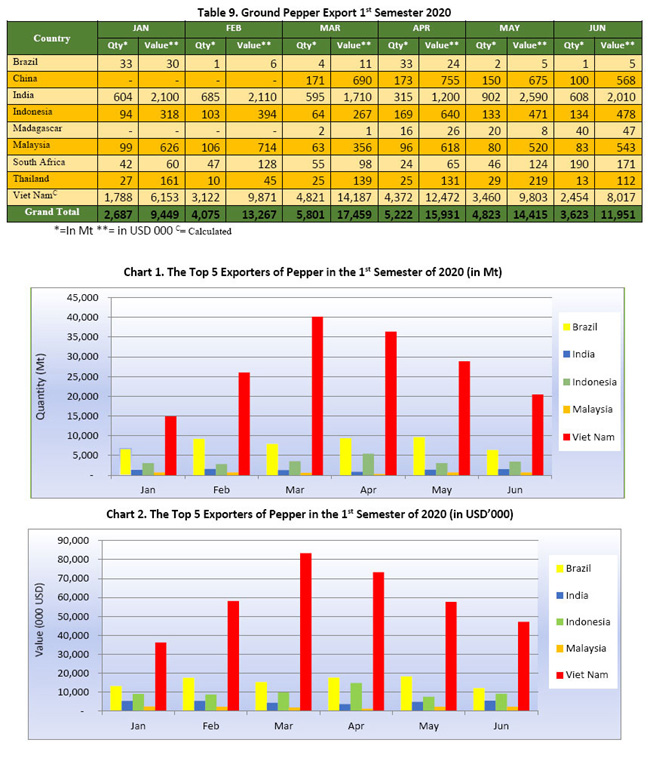
World pepper export from pepper producing countries in the 1st semester of 2020 (January - June) fluctuated with the highest export reported in March 2020 with a total of 54,309 Mt whilst the lowest export occurred in January which only reached 27,020 Mt. When comparing January to June 2020, pepper export from origins recorded an increase of 24% which resulted to 33,509 Mt (Table 8). As of the 1st semester 2020 the top three pepper exporters were Viet Nam with 166,812 Mt or 66% of the total export of pepper producing countries, followed by Brazil with 49,213 Mt (19%) and Indonesia with 21,255 Mt (8%).
Viet Nam
During January-June 2020, Viet Nam was reported to have exported a total of 166,812 Mt with calculation of 88% or 146,795 Mt of whole pepper and 12% or 20,017 Mt of ground pepper. Pepper export from Viet Nam during the 1st semester of 2020 fluctuated with an average export of pepper amounted to 27,802 Mt per month with the highest export reported in March with 40,178 Mt while the lowest export occurred in January with 14,899 Mt. The highest figure of Viet Nam pepper export in March could be contributed to Viet Nam being in the middle of pepper harvest. The highest increase of pepper export by Viet Nam during the 1st semester of 2020 occurred in February with an increase by 75% as compared with the previous month to a total of 26,017 Mt. In June 2020, Viet Nam exported a total of 20,449 Mt, thus recording an increase of 37% or 5,550 Mt as compared with January. By the end of the 1st semester 2020, Viet Nam's total revenue from pepper export was reported to be as high as USD 355.9 Million.
Furthermore, as of June 2020 Viet Nam's top 5 Country destinations for its pepper were reported to be China with 36,174 Mt (many cross border and undocumented trade) or 21% of the total pepper exported in the 1st semester by Viet Nam, United States of America with 28,769 Mt (17%) Vietnam Pepper Association Data, India with 8,673 Mt (5%) Vietnam Pepper Association Data, Pakistan with 7,201 Mt (4%) and Egypt with 6,674 Mt (4%).
Brazil
During January-June 2020, Brazil was reported to have exported a total of 49,213 Mt which comprised of 99.8% or 49,139 Mt of whole pepper and 0.2% or 74 Mt of ground pepper. Pepper export from Brazil during the 1st semester 2020 fluctuated with an average export of pepper amounted to 8,202 Mt per month of which the highest export was reported in May with 9,617 Mt while the lowest export occurred in June with 6,399 Mt. The highest increase of pepper export by Brazil occurred in February with an increase of 36% as compared with the previous month to a total of 9,183 Mt. In June 2020, Brazil exported a total of 6,399 Mt, thus recording a decrease of 5% or 339 Mt as compared with January 2020. By the end of the 1st semester 2020, Brazil's total revenue from pepper export was reported to be as high as USD 94.1 Million. Furthermore, as of June 2020 Brazil's top 5 Country destinations for its pepper were reported to be United States of America with 6,761 Mt or 14% of the total pepper exported in the 1st semester by Brazil, Morocco with 5,828 Mt (12%), Germany with 5,283 Mt (11%), Viet Nam with 5,101 Mt (10%) and Egypt with 4,341 Mt (9%).
Indonesia
During January-June 2020, Indonesia was reported to have exported a total of 21,255 Mt which comprised of 97% or 20,558 Mt of whole pepper and 3% or 697 Mt of ground pepper. Pepper export from Indonesia during the 1st semester 2020 fluctuated with an average export amounted to 3,543 Mt per month with the highest export was reported in April with 5,433 Mt while the lowest export occurred in February with 2,798 Mt. The highest increase of pepper export by Indonesia occurred in April with an increase of 54% as compared with the previous month to a total of 5,433 Mt. In June 2020, Indonesia exported a total of 3,443 Mt, thus recording an increase of 14% or 422 Mt as compared to January 2020. By the end of the 1st semester 2020, Indonesia's total revenue from pepper export was reported to be as high as USD 59.1 Million. Furthermore, as of June 2020, Indonesia's top 5 Country destinations for its pepper were reported to be Viet Nam with 5,348 Mt or 25% of the total pepper exported in 1st semester by Indonesia, China with 5,116 Mt (24%), United States of America with 2,876 Mt (14%), India with 1,724 Mt (8%) and Japan with 754 Mt (4%).
India
During January-June 2020, India was reported to have exported a total of 7,856 Mt which comprised of 53% or 4,148 Mt of whole pepper and 47% or 3,709 Mt of ground pepper. Pepper export from India during the 1st semester 2020 fluctuated with average export of pepper was reported amounting to 1,309 Mt per month and the highest export recorded in February with 1,534 Mt while the lowest export occurred in April with 864 Mt. The highest figure of India pepper export in February could be contributed to India being in the middle of harvest. The highest increase of pepper export by India occurred in May with an increase by 60% as compared with the previous month to a total of 1,386 Mt. In June 2020, India exported a total of 1,512 Mt, thus recording an increase of 17% or 220 Mt as compared with January 2020. By the end of the 1st semester 2020, India's total revenue from pepper export was reported to be as high as USD 29.0 Million.
Furthermore, as of June 2020 India's top 5 Country destinations for its pepper were reported to be United States of America with 2,113 Mt or 27% of the total pepper exported in 1st semester by India, United Kingdom with 658 Mt (8%), Canada with 478 Mt (6%), Sweden with 395 Mt (5%) and Spain with 366 Mt (5%).
Malaysia
During January-June 2020, Malaysia was reported to have exported a total of 3,626 Mt which comprised of 85% or 3,099 Mt of whole pepper and 15% or 527 Mt of ground pepper. Pepper export from Malaysia during the 1st semester 2020 fluctuated with average export of pepper amounted to 604 Mt per month with the highest export recorded in May with 703 Mt while the lowest export occurred in April with 334 Mt. The highest figure of Malaysia pepper export in May could be contributed to Malaysia beginning the harvest. The highest increase of pepper export by Malaysia occurred in May with an increase by 110% as compared with the previous month to a total of 703 Mt. In June 2020, Malaysia exported a total of 665 Mt, thus recording a slight decrease of 1% or 9 Mt as compared to January 2020. By the end of the 1st semester 2020, Malaysia's total revenue from pepper export was reported to be as high as USD 12.3 Million. Furthermore, as of June 2020 Malaysia's top 5 Country destinations for its pepper were reported to be Japan with 1,485 Mt or 41% of the total pepper exported in 1st semester by Malaysia, China with 701 Mt (19%), Taiwan with 319 Mt (9%), Singapore with 290 Mt (8%) and Viet Nam with 221 Mt (6%).
South Africa
During January-June 2020, South Africa was reported to have exported a total of 1,509 Mt which comprised of 73% or 1,105 Mt of whole pepper and 27% or 404 Mt of ground pepper. Pepper export from South Africa during the 1st semester 2020 fluctuated with average export of pepper amounted to 252 Mt per month with the highest export recorded in June with 346 Mt while the lowest export occurred in January with 208 Mt. The highest increase of pepper export by South Africa occurred in June with an increase by 35% as compared with the previous month to a total of 346 Mt. In June 2020, South Africa exported a total of 346 Mt, thus recording an increase of 66% or 138 Mt as compared with January 2020. By the end of the 1st semester 2020, South Africa's total revenue from pepper export was reported to be as high as USD 6.5 Million. Furthermore, as of June 2020, South Africa's top 5 Country destinations for its pepper were reported to be United States of America with 408 Mt or 27% of the total pepper exported in 1st semester by South Africa, Botswana with 277 Mt (18%), Australia with 222 Mt (15%), Japan with 180 Mt (12%) and Namibia with 69 Mt (5%).
Madagascar
During January-June 2020, Madagascar was reported to have exported a total of 1,233 Mt which comprised of 94% or 1,155 Mt of whole pepper and 6% or 78 Mt of ground pepper. Pepper export from Madagascar during the 1st semester 2020 fluctuated with an average export of pepper amounted to 205 Mt per month with the highest export recorded in June with 465 Mt while the lowest export occurred in February with 67 Mt. The highest increase of pepper export by Madagascar occurred in March with an increase by 135% as compared with the previous month to a total of 158 Mt. In June 2020, Madagascar exported a total of 465 Mt, thus recording a significant increase of 239% or 328 Mt as compared with January 2020. By the end of the 1st semester 2020, Madagascar's total revenue from pepper export was reported to be as high as USD 2.5 Million.
Furthermore, as of June 2020 Madagascar's top 5 Country destinations for its pepper were reported to be France with 173 Mt or 14% of the total pepper exported in 1st semester by Madagascar, Belgium with 163 Mt (13%), United Arab Emirates with 136 Mt (11%), Turkey with 125 Mt (10%) and Singapore with 104 Mt (8%).
China
During January-June 2020, China was reported to have exported a total of 976 Mt which comprised of 39% or 382 Mt of whole pepper and 61% or 594 Mt of ground pepper. In the first 2 months of 2020, Business in China was reported to be inactive due to the global pandemic that emerged at the end of 2019.
https://www.cnbc.com/2020/03/07/coronavirus-china-jan-feb-2020-trade-data-reflects-outbreaks-impact.html
Furthermore, Pepper export from China during the 1st semester 2020 fluctuated with a decreasing trend and recorded an average export of pepper amounted to 163 Mt per month with the highest export recorded in April with 289 Mt while the lowest export occurred in June with 190 Mt. The highest increase of pepper export by China occurred in April with an increase by 28% as compared with the previous month to a total of 289 Mt. By the end of the 1st semester 2020, China's total revenue from pepper export was reported to be as high as USD 4.8 Million.
Furthermore, as of June 2020 China's top 5 Country destinations for its pepper were reported to be Romania with 288 Mt or 30% of the total pepper exported in 1st semester by China, Hong Kong with 132 Mt (14%), Germany with 116 Mt (12%), United States of America with 100 Mt (10%) and Taiwan with 59 Mt (6%).
Thailand
During January-June 2020, Thailand was reported to have exported a total of 471 Mt which comprised of 73% or 342 Mt of whole pepper and 27% or 129 Mt of ground pepper. Pepper export from Thailand during the 1st semester 2020 fluctuated with average export of pepper amounted to 79 Mt per month with the highest export recorded in March with 216 Mt while the lowest export occurred in June with 40 Mt. The highest increase of pepper export by Thailand occurred in March with a significant increase by 414% or 174 Mt as compared with the previous month to a total of 216 Mt. In June 2020, Thailand exported a total of 40 Mt, thus recording a decrease of 22% or 11 Mt as compared with January 2020. By the end of the 1st semester 2020, Thailand's total revenue from pepper export was reported to be as high as USD 2.6 Million.
Furthermore, as of June 2020 Thailand's top 5 Country destinations for its pepper were reported to be Myanmar with 172 Mt or 37% of the total pepper exported in 1st semester by Thailand, South Africa with 127 Mt (27%), United States of America with 61 Mt (13%), Australia with 20 Mt (4%) and South Korea with 14 Mt (3%).
World Pepper Import as of the 1st Semester 2020
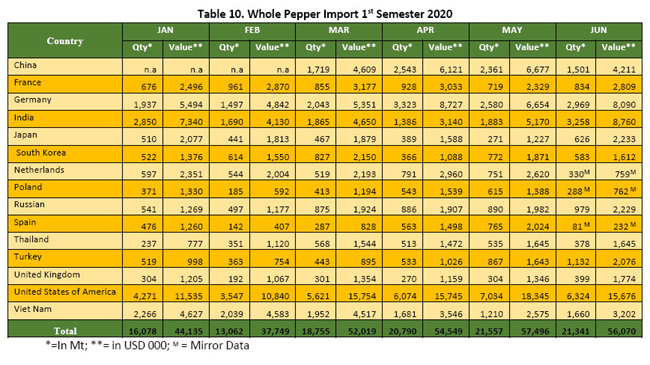
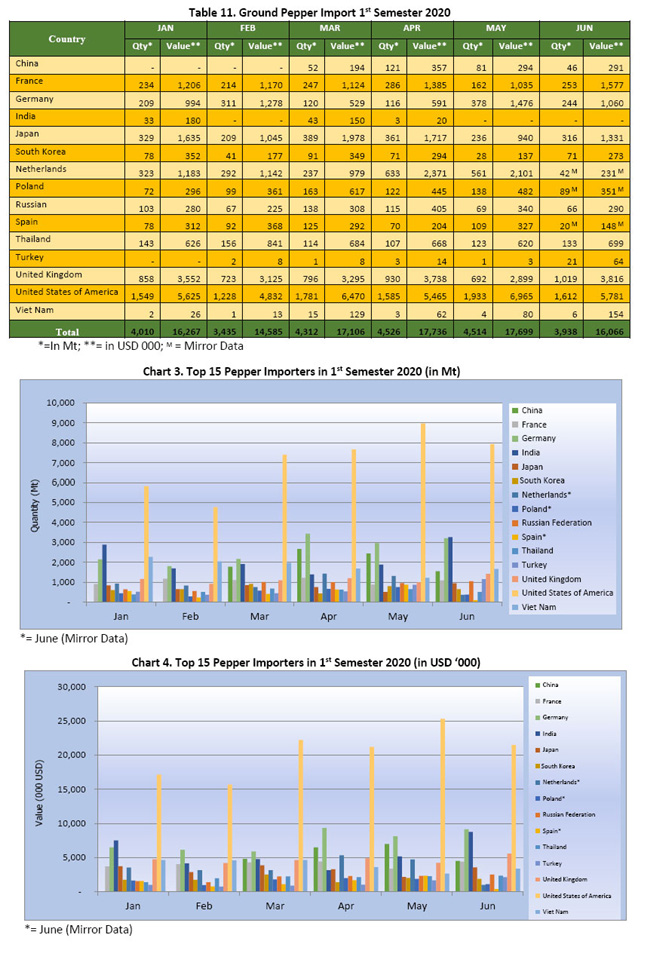
World pepper import of consuming countries during January-June 2020 fluctuated with the highest import reported in May 2020 with 26,071 Mt whilst the lowest import occurred in February with only 16,497 Mt. As of the 1st semester 2020, the top five pepper importer were United States of America with 42,558 Mt or 31% of the total import of 15 major importers in the world, followed by Germany with 15,727 Mt (12%), India with 13,011 Mt (10%), Viet Nam with 10,840 Mt (8%) and United Kingdom with 6,788 Mt (5%).
However, based on mirror data taken from China counterpart, as of the 1st semester of 2020 China had imported a total of 41,155 Mt, putting China as the second largest pepper importers in the 1st semester just behind United States of America.
United States of America
During January-June 2020, United States of America was reported to have imported a total of 42,558 Mt which comprised of 77% or 32,871 Mt of whole pepper and 23% or 9,687 Mt of ground pepper. Pepper imported by United States of America during the 1st semester 2020 fluctuated with an average of import of pepper amounted to 7,093 Mt per month with the highest import recorded in May with 8,967 Mt while the lowest occurred in February with 4,775 Mt. The highest increase of pepper import by United States of America occurred in March with an increase by 55% as compared with the previous month to a total of 7,402 Mt. In June 2020, United States of America imported a total of 7,936 Mt, thus recording an increase of 36% or 2,116 Mt as compared with January 2020. By the end of the 1st semester 2020, United States of America's total expenditure of pepper import was reported to be as high as USD 123.0 Million. Furthermore, as of June 2020 United States of America's top 5 country of origins for its pepper were reported to be Viet Nam with 28,050 Mt or 66% of the total pepper importer in 1st semester by United States of America (ITC), Brazil with 8,106 Mt (19%), Indonesia with 3,003 Mt (7%), India with 2,075 Mt (5%) and China with 265 Mt (1%).
Germany
During January-June 2020, Germany was reported to have imported a total of 15,727 Mt which comprised of 91% or 14,349 Mt of whole pepper and 9% or 1,378 Mt of ground pepper. Pepper imported by Germany during the 1st semester 2020 fluctuated with average import of pepper amounted to 2,621 Mt per month and the highest import recorded in April with 3,439 Mt while the lowest import occurred in February with 1,808 Mt. The highest increase of pepper import by Germany occurred in April with an increase by 59% as compared with the previous month to a total of 3,439 Mt. In June 2020, Germany imported a total of 3,213 Mt, thus recording an increase of 50% or 1,067 Mt as compared with January 2020. By the end of the 1st semester 2020, Germany's total expenditure of pepper import was reported to be as high as USD 45.0 Million.
Furthermore, as of June 2020 Germany's top 5 country of origins for its pepper were reported to be Viet Nam with 6,610 Mt or 42% of the total pepper imported in 1st semester by Germany, Brazil with 6,501 Mt (41%), Indonesia with 819 Mt (5%), India with 548 Mt (3%) and Cambodia with 354 Mt (2%).
Viet Nam (Mirror Data)
During January-June 2020, Viet Nam was reported to have imported a total of 10,840 Mt which comprised of 99.7% or 10,809 Mt of whole pepper and 0.3% or 32 Mt of ground pepper. Pepper imported by Viet Nam during the 1st semester 2020 fluctuated with a decreasing trend with average of import pepper by Viet Nam amounted to 1,807 Mt per month with the highest import recorded in January with 2,268 Mt while the lowest import occurred in May with 1,214 Mt. The highest increase of pepper import by Viet Nam occurred in June with an increase by 37% as compared with the previous month to a total of 1,666 Mt. In June 2020, Viet Nam imported a total of 1,666 Mt, thus recording a decrease of 27% or 602 Mt as compared with January 2020. By the end of the 1st semester 2020, Viet Nam's total expenditure of pepper import was reported to be as high as USD 23.5 Million.
Furthermore, as of June 2020 Viet Nam's top 5 country of origins for its pepper were reported to be Indonesia with 5,348 Mt or 49% of the total pepper imported in 1st semester by Viet Nam (ITC), Brazil with 5,101 Mt (47%), Malaysia with 221 Mt (2%), South Korea with 59 Mt (1%) and Singapore with 55 Mt (1%).
India
During January-June 2020, India was reported to have imported a total of 13,011 Mt which comprised of 99.4% or 12,932 Mt of whole pepper and 0.6% or 79 Mt of ground pepper. Pepper imported by India during the 1st semester 2020 fluctuated with an increasing trend. The average import of pepper by India amounted to 2,168 Mt per month with the highest import recorded in June with 3,258 Mt while the lowest import occurred in April with 1,389 Mt. The highest increase of pepper import by India occurred in June with an increase by 73% as compared with the previous month to a total of 3,258 Mt. In June 2020, India imported a total of 3,258 Mt, thus recording an increase of 13% or 375 Mt as compared with January 2020. By the end of the 1st semester 2020, India's total expenditure of pepper import was reported to be as high as USD 33.5 Million.
Furthermore, as of June 2020 India's top 5 country of origins for its pepper were reported to be Viet Nam with 6,294 Mt or 48% of the total pepper imported in 1st semester by India (ITC), Brazil with 2,794 Mt (21%), Indonesia with 1,740 Mt (13%), Sri Lanka with 1,588 Mt (12%) and Ecuador with 403 Mt (3%).
United Kingdom
During January-June 2020, United Kingdom was reported to have imported a total of 6,788 Mt which comprised of 26% or 1,771 Mt of whole pepper and 74% or 5,017 Mt of ground pepper. Pepper imported by United Kingdom during the 1st semester 2020 fluctuated with the average of import of pepper amounted to 1,131 Mt per month with the highest import recorded in June with 1,418 Mt while the lowest import occurred in February with 915 Mt. The highest increase of pepper import by United Kingdom occurred in June with an increase by 42% as compared with the previous month. In June 2020, United Kingdom imported a total of 1,418 Mt, thus recording an increase of 22% or 256 Mt as compared with January 2020. By the end of the 1st semester 2020, United Kingdom's total expenditure of pepper import was reported to be as high as USD 28.3 Million.
Furthermore, as of June 2020 United Kingdom's top 5 country of origins for its pepper were reported to be Viet Nam with 2,997 Mt or 44% of the total pepper imported in 1st semester by United Kingdom, Netherlands with 1,401 Mt (21%), India with 650 Mt (10%), France with 435 Mt (6%) and Spain with 291 Mt (4%).
China (Mirror Data)
Acquired from China counterpart data, during January-June 2020 China was reported to have imported a total of 41,155 Mt with most of its pepper were reported to come from Viet Nam. Thus, making China the second largest pepper importer in the world. As of June 2020, China top 3 country of origins for its pepper were calculated to be Viet Nam with 36,174 Mt or 88% of the total pepper imported in 1st semester by China, Indonesia with 4,105 Mt (10%) and Malaysia with 576 Mt (1%).
Source:
• Brazil, Unofficial source (Coreimex, CSG Trade)
• India: AISEF, NCDEX, Indian Chamber of Commerce & Industry
• Indonesia: Unofficial source
• Sri Lanka: Sri Lankan Pepper Board
• Sri Lanka: Department of Export Agriculture
• Viet Nam : Viet Nam Pepper Association, HCMC
• China: Hainan Pepper Association, China Spice Association
• International Trade Centre (ITC) - Geneva
Note: Some of the data in this publication are from the IPC database. The data are obtained from official reports and correspondence between the IPC and have been processed based on statistical norms that can be accounted for.
Previous Publications
- Market Review - August 2017
- Market Review - July 2017
- Market Review - June 2017
- Market Review - May 2017
- "Market Review - April 2017 "
- Market Review - March 2017
- Market Review - February 2017
- Market Review - January 2017
- Market Review - December 2016
- Market Review - November 2016
- Market Review - October 2016
- Market Review - September 2016
- Market Review - August 2016
- Market Review - July 2016
- Market Review - June 2016
- Market Review - May 2016
- Market Review - April 2016
- Market Review - March 2016
- Market Review - February 2016
- Market Review - January 2016
- Market Review - December 2015
- Market Review - November 2015
- Market Review - October 2015
- Market Review - September 2015
- Market Review - August 2015