a UNESCAP Intergovermental Organization
a UNESCAP Intergovermental Organization
Monthly Publication
MARKET REVIEW - October 2019
PRICE HISTORY
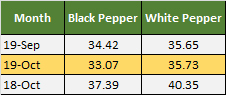
October 2019, price index was reported with mixed response. Losing 1.35 points, price index of black pepper was reported with the second biggest drop in 2019 by 3.9% when compared to the previous month at 34.42 (Table 1). However, when compared with the same period in 2018, price index of black pepper recorded a 12% loss. Contrary to price index of black pepper, price index of white pepper gained slightly by 0.08 points and was reported with 0.2% increase as opposed to the previous month. Furthermore, when compared with the same period in 2018, price index of white pepper recorded an 11% loss.
Table 1. IPC Price Index (Base price: Average 2011-2015)
Composite price of black and white pepper for the 10th month of 2019 were reported with mixed response. Losing USD 100 per Mt as opposed to the previous month, the composite price of black pepper was reported at USD 2,460 per Mt. October 2019 saw composite price of white pepper recorded an increase of USD 8 per Mt as opposed to September 2019 and was reported at USD 3,697 per Mt (Table 2).
Table 2. Composite Price of Black and White Pepper (US$/Mt)
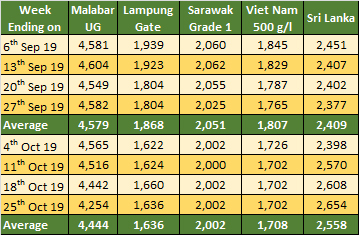
Pepper prices in 10th month of 2019, showed a mixed response with Indonesia origin was reported with the biggest drop as opposed to the previous month. The farm gate of black pepper in India was reported at an average of USD 4,444 per Mt (Table 3). Recording a 3% deficit when compared with September 2019. The impact of global oversupply and the continuous rise of pepper import to India flouting the MIP at Rs. 500/Kg (as many sellers provided fraudulent invoice of Rs. 500/Kg just to convince the Custom) have pushed India black pepper to reach its lowest price of the year. In the local currency farm gate price of India black pepper was traded at an average of INR 314 per Kg in October 2019. Following the new crops which will begin in December, the price could fall deeper.
The price of black pepper in Indonesia (Lampung black pepper) recorded a significant deficit when compared to September 2019. The farm gate price of Lampung black pepper for October 2019 was reported to be at an average of USD 1,636 per Mt, recording a decrease of USD 232 per Mt or 12% as compared to the previous month. With a significant more yield this year, market was flooded with more stock which pushed down price in local currency to an average of IDR 23,132 per Kg. However, many farmers were reported to keep their pepper in the hope for a better price.
The farm gate price of black pepper in Malaysia was also reported with a deficit. In October 2019, the farm gate price of black pepper in Malaysia was reported at an average of USD 2,002 per Mt which was the lowest ever in 2019, recording a deficit by 2% as compared to September 2019. The farm gate price of black pepper Malaysia in the local currency dropped to an average of MYR 8.3 per Kg from MYR 8.5 per Kg in September 2019.
Farm gate price of black pepper in Viet Nam for October 2019 was reported to have decreased by 5% as opposed to previous month averaging at USD 1,708 per Mt. Whilst, Sri Lanka black pepper was reported to climb back up with an increase by 6% as opposed to the previous month and was reported at an average of USD 2,558 per Mt.
Table 3. Farm Gate Prices of Black Pepper (US$ per Mt)
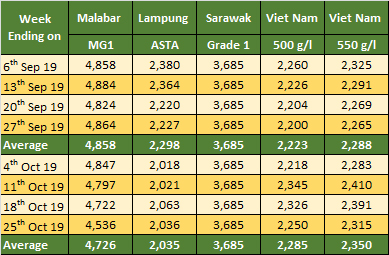
FOB price of black pepper was reported with better outlook than farm gate prices (Table 4). The weakening of the price in the local currency, pushed down the FOB price of black pepper in India by the same 3% as compared with the previous month and was reported at an average of USD of 4,726 per Mt. Furthermore, the FOB price of black pepper in Indonesia was also reported to have significant decreased by 11% as opposed to previous month averaging at USD 2,035 per Mt. Contrary to the farm gate level, FOB price of Malaysian black pepper was reported stable at an average of USD 3,685 per Mt. Meanwhile, FOB price of Viet Nam black pepper 500 g/l and 550 g/l were reported with an increase by 3% as compared to the previous month with an average of USD 2,285 per Mt and USD 2,350 per Mt respectively.
Table 4. FOB Prices of Black Pepper (US$ per Mt)
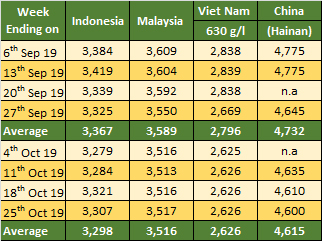
Farm gate prices of white pepper from all origins showed a negative outlook (Table 5) with Viet Nam recording the highest deficit. As Indonesian harvest of Muntok white pepper came to an end, Muntok white pepper was reported with a 2% decrease as compared to the previous month and was traded at an average of USD 3,298 per Mt. In local currency, the price of Muntok white pepper decreased to an average of IDR 46,632 per Kg. Farm gate price of Malaysia white pepper was also reported with a deficit of 2% as compared with the previous month and was traded at an average of USD 3,516 per Mt. Furthermore, Viet Nam white pepper was reported with a significant deficit by 6% as opposed to the previous month at an average of USD 2,626 per Mt. Whilst, China white pepper was traded with a 2% deficit as opposed to the previous month at an average of USD 4,615 per Mt.
Table 5. Farm Gate Prices of White Pepper (US$ per Mt)
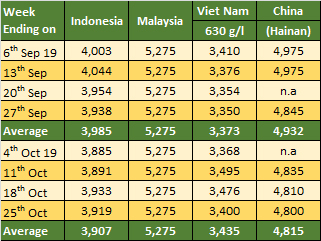
FOB price of white pepper showed a mixed response with only Viet Nam reported an increase. FOB price of white pepper in Indonesia for October 2019 was reported with a deficit by 2% when compared to September 2019 and was reported at an average of USD 3,907 per Mt. Furthermore, FOB price of Malaysia white pepper continued to be reported stable and unchanged. Whilst, Viet Nam FOB price of white pepper recorded an increase of USD 62 per Mt or 2% as compared to the previous month averaging at USD 3,435 per Mt. FOB price of white pepper in China was reported with a deficit by 2% when compared to the previous month and was traded at an average of USD 4,815 per Mt (Table 6).
Table 6. FOB Prices of White Pepper (US$ per Mt)
Highlight on World Pepper Export and Import of Producing and Consuming Countries as of the 1st Semester 2019.
World Pepper Export as of the 1st Semester 2019
World pepper export from pepper producing origins as of January-June 2019 fluctuated with the highest export reported in March 2019 with 53,677 Mt whilst the lowest export occurred in January which reached only 32,157 Mt. From January to June 2019 pepper export from origins reported an increase of 27% which amounted to 40,827 Mt (Table 7). As of the 1st semester 2019 the top three pepper exporter were Viet Nam with 178,318 Mt or 69% from world total export, followed by Brazil with 42,759 Mt or 16% from world total export and Indonesia with 22,531 Mt or 9% from world total export.
Viet Nam
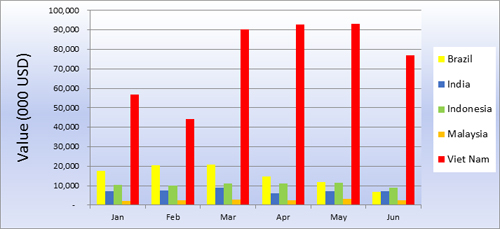
During January-June 2019, Viet Nam was reported to have exported a total of 178,318 Mt which comprised of 88% or 156,920 Mt of whole pepper and 12% or 21,398 Mt of ground pepper. Pepper export from Viet Nam during the 1st semester 2019 fluctuated with an average export of pepper amounted to Mt 29,720 per month with the highest export reported in May with 38,318 Mt while the lowest export occurred in February with 16,756 Mt. The highest figure of Viet Nam pepper export in May could be contributed that Viet Nam's harvest of pepper came to full swing in the end of May. The highest increase of pepper export by Viet Nam reported occurred in March with an increase by 115% or 19,218 Mt as compared with the previous month which only amounted to 16,756 Mt. In June 2019, Viet Nam exported a total of 31,761 Mt, thus recording an increase of 76% or 13,723 Mt as compared with January. By the end of the 1st semester 2019, Viet Nam's total revenue from pepper export was reported to be as high as USD 453.8 Million.
Furthermore, as of June 2019 Viet Nam's top 5 Country destinations for its pepper were reported to be China with 45,467 Mt (many cross border and undocumented trade), United States of America with 26,711 Mt, India with 13,945 Mt, Pakistan with 7,737 Mt and Germany with 6,871 Mt.
Brazil
During January-June 2019, Brazil was reported to have exported a total of 42,759 Mt which comprised of 99.9% or 42,731 Mt of whole pepper and 0.1% or 28 Mt of ground pepper. Pepper export from Brazil during the 1st semester 2019 fluctuated with an average export of pepper amounted to Mt 7,127 per month of which the highest export was reported in March with 10,070 Mt while the lowest export occurred in June with 3,047 Mt. The highest increase of pepper export by Brazil occurred in February with an increase of 22% or 1,746 Mt as compared with the previous month which only amounted to 7,781 Mt. In June 2019, Brazil exported a total of 3,047 Mt, thus recording a decrease of 61% or 4,734 Mt as compared with January 2019. By the end of the 1st semester 2019, Brazil's total revenue from pepper export was reported to be as high as USD 92.5 Million. Furthermore, as of June 2019 Brazil's top 5 Country destinations for its pepper were reported to be Germany with 5,109 Mt, United States of America with 4,899 Mt, Viet Nam with 4,528 Mt, Egypt with 2,619 Mt and Netherlands with 1,566 Mt.
Indonesia
During January-June 2019, Indonesia was reported to have exported a total of 22,531 Mt which comprised of 97% or 21,891 Mt of whole pepper and 3% or 640 Mt of ground pepper. Pepper export from Indonesia during the 1st semester 2019 fluctuated with an average export amounted to 3,755 Mt per month of which the highest export was reported in March with 4,527 Mt while the lowest export occurred in June with 3,214 Mt. The highest increase of pepper export by Indonesia occurred in March with an increase of 31% or 1,058 Mt as compared with the previous month that only amounted to 3,469 Mt. In June 2019, Indonesia exported a total of 3,214 Mt, thus recording a decrease of 15% or 546 Mt as compared with January 2019. By the end of the 1st semester 2019, Indonesia's total revenue from pepper export was reported to be as high as USD 63.1 Million. Furthermore, as of June 2019, Indonesia's top 5 Country destinations for its pepper were reported to be Viet Nam with 11,695 Mt, India with 2,439 Mt, United States with 2,170 Mt, China with 785 Mt and Japan with 737 Mt.
India
During January-June 2019, India was reported to have exported a total of 9,760 Mt which comprised of 45% or 4,373 Mt of whole pepper and 55% or 5,387 Mt of ground pepper. Pepper export from India during the 1st semester 2019 showed dynamic movement with an increasing trend and average export of pepper was reported amounting to 1,627 Mt per month with the highest export reported in March with 1,968 Mt while the lowest export occurred in April with 1,389 Mt. The highest increase of pepper export by India occurred in March with an increase by 29% or 441 Mt as compared with the previous month which only reached 1,528 Mt. In June 2019, India exported a total of 1,750 Mt, thus recording an increase of 21% or 302 Mt as compared with January 2019. By the end of the 1st semester 2019, India's total revenue from pepper export was reported to be as high as USD 43.6 Million.
Furthermore, as of June 2019 India's top 5 Country destinations for its pepper were reported to be United States of America with 3,616 Mt, Spain with 727 Mt, United Kingdom with 708 Mt, Sweden with 496 Mt and Canada with 429 Mt.
Malaysia
During January-June 2019, Malaysia was reported to have exported a total of 4,153 Mt which comprised of 84% or 3,507 Mt of whole pepper and 16% or 646 Mt of ground pepper. Pepper export from Malaysia during the 1st semester 2019 fluctuated with average export of pepper amounted to Mt 692 Mt per month with the highest export reported in May with 800 Mt while the lowest export occurred in January with 541 Mt. The highest increase of pepper export by Malaysia occurred in February with an increase by 40% or 214 Mt as compared with the previous month that only reached 541 Mt. In June 2019, Malaysia exported a total of 650 Mt, thus recording an increase of 20% or 109 Mt as compared with January 2019. By the end of the 1st semester 2019, Malaysia's total revenue from pepper export was reported to be as high as USD 15.7 Million. Furthermore, as of June 2019 Malaysia's top 5 Country destinations for its pepper were reported to be Japan with 1,508 Mt, China with 1,041 Mt, Taiwan with 499 Mt, Singapore with 292 Mt and South Korea with 148 Mt.
Madagascar
During January-June 2019, Madagascar was reported to have exported a total of 1,182 Mt which comprised of 97% or 1,149 Mt of whole pepper and 3% or 33 Mt of ground pepper. Pepper export from Madagascar during the 1st semester 2019 fluctuated with a decreasing trend and recorded an average export of pepper amounted to Mt 197 Mt per month with the highest export reported in January with 330 Mt while the lowest export occurred in May with 105 Mt. The highest increase of pepper export by Madagascar occurred in June with an increase by 103% or 108 Mt as compared with the previous month which only reached 105 Mt. In June 2019, Madagascar exported a total of 212 Mt, thus recording a decrease of 36% or 117 Mt as compared with January 2019. By the end of the 1st semester 2019, Madagascar's total revenue from pepper export was reported to be as high as USD 2.3 Million.
Furthermore, as of June 2019 Madagascar's top 5 Country destinations for its pepper were reported to be United Arab Emirates with 159 Mt, Belgium with 154 Mt, France with 152 Mt, Sudan with 95 Mt and Thailand with 95 Mt.
China
During January-June 2019, China was reported to have exported a total of 958 Mt which comprised of 64% or 610 Mt of whole pepper and 36% or 348 Mt of ground pepper. Pepper export from China during the 1st semester 2019 fluctuated with average export of pepper amounted to 160 Mt per month with the highest export recorded in January with 221 Mt while the lowest export occurred in June with 124 Mt. The highest increase of pepper export by China occurred in March with an increase by 15% or 21 Mt as compared with the previous month which only amounted to 137 Mt. In June 2019, China exported a total of 124 Mt, thus recording a decrease of 44% or 97 Mt as compared with January 2019. By the end of the 1st semester 2019, China's total revenue from pepper export was reported to be as high as USD 6.4 Million.
Furthermore, as of June 2019 China's top 5 Country destinations for its pepper were reported to be North Korea with 320 Mt, Hong Kong with 136 Mt, United States of America with 126 Mt, Germany with 105 Mt and Thailand with 44 Mt.
Thailand
During January-June 2019, Thailand was reported to have exported a total of 262 Mt which comprised of 56% or 148 Mt of whole pepper and 44% or 114 Mt of ground pepper. Pepper export from Thailand during the 1st semester 2019 fluctuated with average export of pepper amounted to 44 Mt per month with the highest export reported in June with 69 Mt while the lowest export occurred in February with 15 Mt. The highest increase of pepper export by Thailand occurred in March with an increase by 249% or 37 Mt as compared with the previous month that only reached 15 Mt. In June 2019, Thailand exported a total of 69 Mt, thus recording an increase of 82% or 31 Mt as compared with January 2019. By the end of the 1st semester 2019, Thailand's total revenue from pepper export was reported to be as high as USD 2.4 Million.
Furthermore, as of June 2019 Thailand's top 5 Country destinations for its pepper were reported to be South Africa with 110 Mt, United States of America with 50 Mt, China with 11 Mt, Australia with 9 Mt and Cambodia with 9 Mt.
Table 7. Quantity of World Whole Pepper Export Jan-Jun 2019
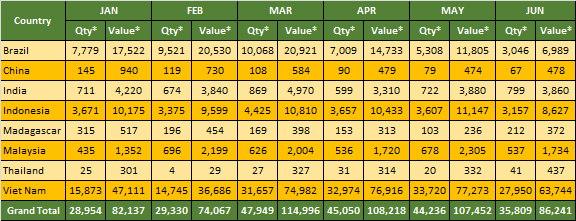
*=In Mt **= in USD 000
Table 8. Quantity of World Ground Pepper Export Jan-Jun 2019
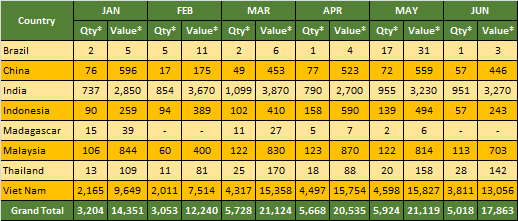
*=In Mt **= in USD 000
Chart 1. Total Quantity of Export (Jan-Jun 2019)
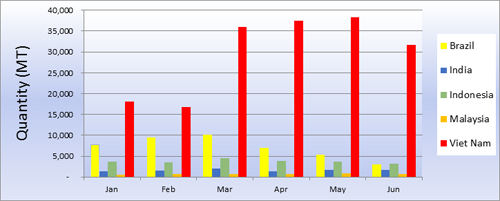
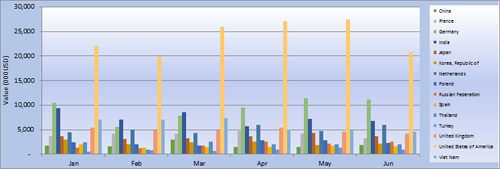
Chart 2. Total Value of Export (Jan-Jun 2019)
World Pepper Import as of the 1st Semester 2019
World pepper import of consuming countries during January-June 2019 fluctuated with the highest export reported in May 2019 with 25,670 Mt whilst the lowest export occurred in February with only 20,196 Mt. As of the 1st semester 2019, the top five pepper importer were United States of America with 43,981 Mt or 31% from world total import, followed by Germany with 16,496 Mt or 12% from world total import, Viet Nam with 16,407 Mt or 12% from world total import, India with 15,525 Mt or 11% from world total import and Netherlands with 8,004 Mt or 6% from world total import. However, based on mirror data taken from China counterpart, as of the 1st semester of 2019 China had imported a total of 45,838 Mt.
United States of America
During January-June 2019, United States of America was reported to have imported a total of 43,981 Mt which comprised of 76% or 33,241 Mt of whole pepper and 24% or 10,740 Mt of ground pepper. Pepper imported by United States of America during the 1st semester 2019 fluctuated with an average of import of pepper amounted to 7,330 Mt per month with the highest import reported in May with 8,864 Mt while the lowest occurred in February with 5,847 Mt. The highest increase of pepper import by United States of America occurred in March with an increase by 32% or 1,891 Mt as compared with the previous month which only amounted to 5,847 Mt. In June 2019, United States of America imported a total of 6,429 Mt, thus recording a slight increase of 1% or 44 Mt as compared with January 2019. By the end of the 1st semester 2019, United States of America's total expenditure of pepper import was reported to be as high as USD 143.2 Million. Furthermore, as of June 2019 United States of America's top 5 origin countries for its pepper were reported to be Viet Nam with 28,702 Mt, Brazil with 6,408 Mt, India with 3,434 Mt, Indonesia with 2,719 Mt and Germany with 832 Mt.
Germany
During January-June 2019, Germany was reported to have imported a total of 16,496 Mt which comprised of 92% or 15,258 Mt of whole pepper and 8% or 1,238 Mt of ground pepper. Pepper imported by Germany during the 1st semester 2019 fluctuated with an increasing trend. The average import of pepper amounted to 2,749 Mt per month with the highest import reported in June with 3,436 Mt while the lowest import occurred in February with 1,634 Mt. The highest increase of pepper import by Germany occurred in March with an increase by 38% or 628 Mt as compared with the previous month which only amounted to 1,634 Mt. In June 2019, Germany imported a total of 3,436 Mt, thus recording an increase of 15% or 451 Mt as compared with January. By the end of the 1st semester 2019, Germany's total expenditure of pepper import was reported to be as high as USD 55.9 Million.
Furthermore, as of June 2019 Germany's top 5 origin countries for its pepper were reported to be Brazil with 6,984 Mt, Viet Nam with 6,206 Mt, Indonesia with 990 Mt, India with 706 Mt and Sri Lanka with 507 Mt.
Viet Nam (Mirror Data)
During January-June 2019, Viet Nam was reported to have imported a total of 16,407 Mt which comprised of 99% or 16,292 Mt of whole pepper and 1% or 116 Mt of ground pepper. Pepper imported by Viet Nam during the 1st semester 2019 fluctuated with the average of import pepper amounted to Mt 2,735 per month with the highest import reported in March with 3,859 Mt while the lowest import occurred in May with 1,939 Mt. The highest increase of pepper import by Viet Nam occurred in March with an increase by 17% or 558 Mt as compared with the previous month which only amounted to 3,301 Mt. In June 2019, Viet Nam imported a total of 2,021 Mt, thus recording a decrease of 34% or 1,028 Mt as compared with January 2019. By the end of the 1st semester 2019, Viet Nam's total expenditure of pepper import was reported to be as high as USD 35.9 Million.
Furthermore, as of June 2019 Viet Nam's top 5 origin countries for its pepper were reported to be Indonesia with 11,695 Mt, Brazil with 4,528 Mt, Malaysia with 131 Mt, Korea with 31 Mt and China with 8 Mt.
India
During January-June 2019, India was reported to have imported a total of 15,525 Mt which comprised of 99.7% or 15,481 Mt of whole pepper and 0.3% or 44 Mt of ground pepper. Pepper imported by India during the 1st semester 2019 fluctuated with an average import of pepper amounted to 2,588 Mt per month with the highest import reported in March with 2,865 Mt while the lowest import occurred in April with 2,198 Mt. The highest increase of pepper import by India occurred in May with an increase by 29% or 641 Mt as compared with the previous month which only amounted to 2,198 Mt. In June 2019, India imported a total of 2,325 Mt, thus recording a decrease of 19% or 533 Mt as compared with January 2019. By the end of the 1st semester 2019, India's total expenditure of pepper import was reported to be as high as USD 44.5 Million.
Furthermore, as of June 2019 India's top 5 origin countries for its pepper were reported to be Viet Nam with 8,197 Mt, Indonesia with 2,963 Mt, Brazil with 2,187 Mt, Sri Lanka with 1,539 Mt and Ecuador with 360 Mt.
Netherlands
During January-June 2019, Netherlands was reported to have imported a total of 8,004 Mt which comprised of 65% or 5,237 Mt of whole pepper and 35% or 2,767 Mt of ground pepper. Pepper imported by Netherlands during the 1st semester 2019 fluctuated with the average of import of pepper amounted to 1,334 Mt per month with the highest import reported in April with 1,668 Mt while the lowest import occurred in January with 1,064 Mt. The highest increase of pepper import by Netherlands occurred in April with an increase by 44% or 513 Mt as compared with the previous month which only amounted to 1,154 Mt. In June 2019, Netherlands imported a total of 1,590 Mt, thus recording an increase of 49% or 526 Mt as compared with January 2019. By the end of the 1st semester 2019, Netherland's total expenditure of pepper import was reported to be as high as USD 30.5 Million.
Furthermore, as of June 2019 Netherlands' top 5 origin countries for its pepper were reported to be Viet Nam with 3,607 Mt, Brazil with 2,260 Mt, Indonesia with 835 Mt, India with 322 Mt and Spain with 283 Mt.
China (Mirror Data)
During January-June 2019, China was reported to have imported a total of 45,838 Mt with most of its pepper were reported to come from Viet Nam with 45,467 Mt.
Table 9. Quantity of Whole Pepper of World Pepper Import Jan-Jun 2019
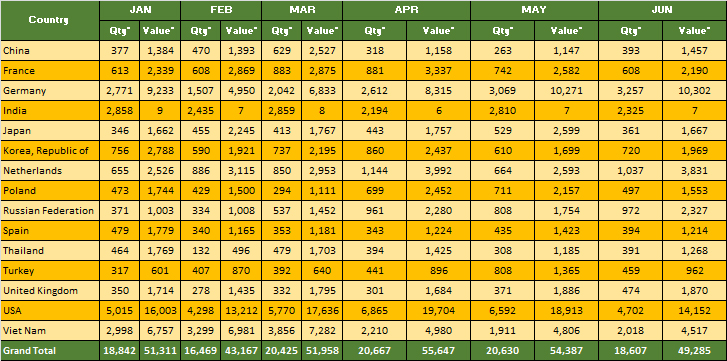
*=In Mt **= in USD 000
Table 10. Quantity of Ground Pepper of World Pepper Import Jan-Jun 2019
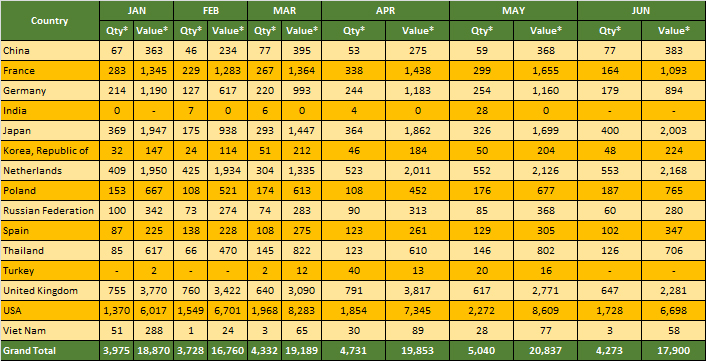
*=In Mt **= in USD 000
Chart 3. Total Quantity of Import (Jan-Jun 2019)
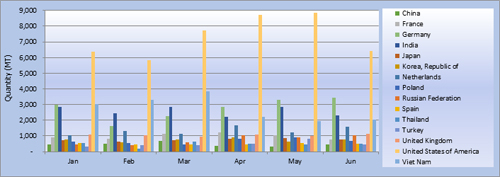
Chart 4. Total Value of Import (Jan-Jun 2019)
Source:
- Brazil, Unofficial source (Coreimex, CSG Trade)
- India: AISEF, NCDEX, Indian Chamber of Commerce & Industry, Spices Board India
- Indonesia: Unofficial source
- Malaysia: Malaysian Pepper Board
- Sri Lanka: Department of Export Agriculture
- Viet Nam : Viet Nam Pepper Association, HCMC
- China: Hainan Pepper Association, China Spice Association
- Office of Agricultural Economics of Thailand
- A.A. SAYIA & Company
- International Trade Centre (ITC) - Geneva
Note: Some of the data in this publication are from the IPC database. The data are obtained from official reports and correspondence between the IPC and Sri Lanka and have been processed based on statistical norms that can be accounted for.
Previous Publications
- Market Review - July 2015
- Market Review - June 2015
- Market Review - May 2015
- Market Review - April 2015
- Market Review - March 2015
- Market Review - February 2015
- Market Review - January 2015
- MARKET REPORT 2014
- Market Review - November 2014
- Market Review - October 2014
- Market Review - September 2014
- Market Review - July 2014
- Market Review - June 2014
- Market Review - April 2014
- Market Review - February 2014
- Market Review - December 2013
- Market Review - November 2013
- Market Review - August 2013
- Market Review - June & July 2013
- Market Review - May 2013
- Market Review - April 2013
- Market Review - March 2013
- Market Review - February 2013
- MARKET REVIEW 2012
- Market Review - November 2012