a UNESCAP Intergovermental Organization
a UNESCAP Intergovermental Organization
Monthly Publication
MARKET REVIEW - APRIL 2020
PRICE HISTORY
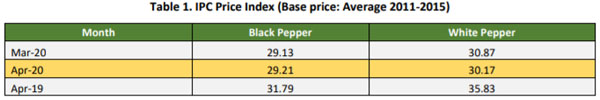
April 2020 showed price index with mixed response. Gaining a marginal increase of 0.09 points when compared with the previous month, price index of black pepper was reported at 29.21. However, as compared with the same period in 2019 the price index of black pepper recorded an 8% drop. Contrary to the price index of black pepper, the price index of white pepper was reported with a 2.3% loss at 30.17 (Table 1) when compared with the previous month. Furthermore, when compared with the same period in 2019, price index of white pepper was reported with a higher 16% loss.
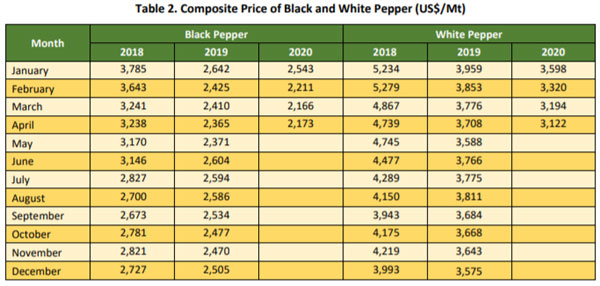
In the 4th month of 2020, composite prices were reported with a mixed response. With an increase of USD 6 per Mt when compared with the previous month, the composite price of black pepper was reported at USD 2,173 per Mt. The composite price of white pepper was reported with a rather significant loss of USD 72 per Mt when compared with the previous month and was at USD 3,122 per Mt. (Table 2).
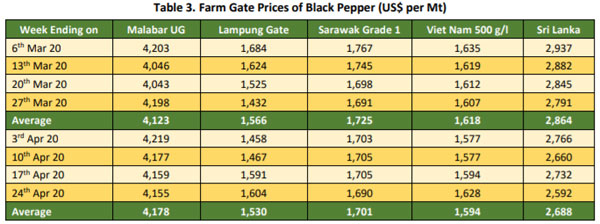
Pepper prices in the 4th month of 2020, showed a mixed response with Sri Lanka origin was reported with the highest decreased. The farm gate price of black pepper in India was reported with an increase of 1% as opposed to March, averaging at USD 4,178 per Mt (Table 3). In the local currency farm gate price of India black pepper was traded at an average of INR 316 per Kg an increased from INR 307 per Kg in the previous month. The slight increase of India black pepper could be contributed to the increase of pepper price in local currency.
The price of black pepper in Indonesia (Lampung black pepper) was reported with a decrease by 2% as opposed to the previous month, averaging at USD 1,530 per Mt. The decrease of Indonesia black pepper could be contributed to the weakening of Indonesia's local currency against the US Dollar (IDR 15,867 for USD 1) or depreciation by 4% when compared to March. In local currency, the price of Indonesia black pepper increased to an average of IDR 24,667 per Kg from IDR 23,667 per Kg in March.
In April 2020, the farm gate price of Malaysia's black pepper was reported with a decrease by 1% as compared to the previous month, averaging at USD 1,701 per Mt. The decrease of Malaysia black pepper could be contributed to the weakening of Malaysia's local currency against the US Dollar (MYR 4.36 for USD 1) or depreciation by 1% when compared with the March. In local currency, the price of Malaysia black pepper was reported stable and unchanged.
Furthermore, farm gate price of black pepper in Viet Nam was also reported with a decreased by 1% as compared to the previous month, averaging at USD 1,594 per Mt. In local currency, the price of Viet Nam black pepper decreased to an average of VND 37,881 per Kg from VND 38,477 per Kg in March.
Sri Lanka black pepper was reported with 6% deficit as opposed to March and was reported at an average of USD 2,688 per Mt. The decrease of Sri Lanka black pepper could be contributed to the weakening of Sri Lanka's local currency against the US Dollar (LKR 193.05 for USD 1) or depreciation by 4% when compared with the March. In local currency, the price of Sri Lanka black pepper decreased to an average of LKR 516.83 per Kg from LKR 527.82 per Kg in March.
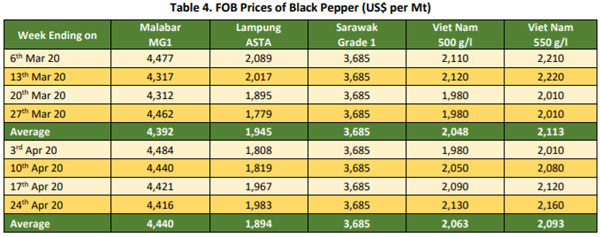
FOB price of black pepper for April 2020 also showed a mixed response with only India and Viet Nam origin was reported with an increase. India was reported with the same increase of 1% when compared to March, averaging at USD 4,440 per Mt (Table 4). Furthermore, the FOB price of Indonesian black pepper was reported with a decrease by 3% as opposed to March, averaging at USD 1,894 per Mt. FOB price of Malaysian black pepper was reported stable at an average of USD 3,685 per Mt. Contrary, FOB price of Viet Nam black pepper 500 g/l was reported with an increase of 1% as compared to the previous month averaging at USD 2,063 per Mt whilst Viet Nam black pepper 550 g/l was reported with 1% deficit as compared to the previous month at an average of USD 2,093 per Mt.
In term of pepper shipment in the first three month of the 2020, a declining trend was reported. India was estimated to have exported 2% less of its black pepper when compared to the same period in 2019. Indonesia shipment of black pepper for the same period was reported with a significant increase of 19% when compared with the same period in 2019. In addition, shipment of black pepper out of Malaysia for the same period was reported with a 6% decrease when compared with the same period in the previous year. Whilst, export of Viet Nam black pepper in the same period was reported with an increase by 14% when compared with the same period in 2019.
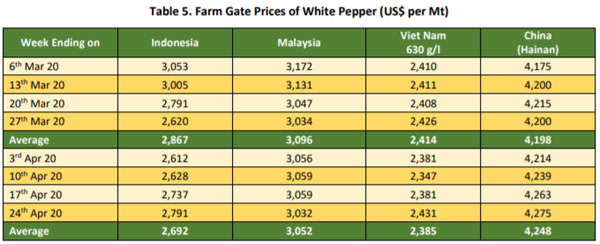
Farm gate prices of white pepper in April 2020 showed a rather negative outlook (Table 5) as only China origin was reported with an increase. Indonesia Muntok white pepper was reported with a significant decrease by 6% as compared to the previous month at an average of USD 2,692 per Mt. In local currency, the price of Muntok white pepper was reported at an average of IDR 43,214 per Kg, losing a slight IDR 24 per Kg when compared with the previous month. Thus, concluding that the major contributing factor of the price deficit was the weakening of Indonesia Rupiah against US Dollar. Farm gate price of Malaysia white pepper was also reported with a decrease by 1% as opposed to March at an average of USD 3,052 per Mt. Furthermore, Viet Nam white pepper was also reported with a decrease by 1% when compared to the previous month, averaging at USD 2,385 per Mt. Contrary to other origins, China white pepper was reported with an increase of 1% as opposed to the previous month and was traded at an average of USD 4,248 per Mt locally.
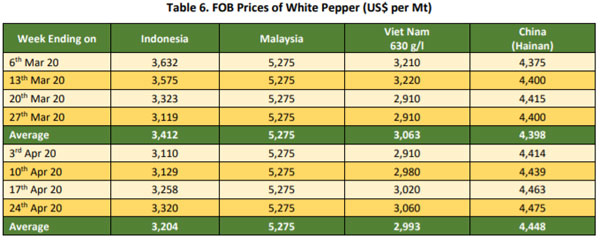
FOB price of white pepper also showed a rather negative outlook with only China origin was reported with an increase. Continuing the trend of the farm gate price, FOB price of Indonesia white pepper for April 2020 was reported with a significant decrease by 6% when compared to March, averaging at USD 3,204 per Mt. Furthermore, FOB price of Malaysia white pepper continued to be reported stable and unchanged. Whilst, FOB price of Viet Nam white pepper was reported with a slightly higher 2% deficit when compared to the previous month at an average of USD 2,993 per Mt. China white pepper was reported with the same 1% increase as compared to the previous month and was traded at an average of USD 4,448 per Mt internationally (Table 6).
Pepper shipment of white pepper in the first three months of the 2020 was reported with a mixed response with a negative outlook. Indonesia shipment of white pepper in the same period was reported with significant decrease of 38% when compared with the same period in 2019. Furthermore, Malaysia was also reported with a slight 6% decrease in the quantity of its white pepper shipment when compared with the same period in 2019. Viet Nam became the only origin which recorded an increase in term of white pepper shipment for the first three months of 2020, an increase of 19% was reported when compared with the same period in 2019.
Highlight on World Pepper Export and Import of Producing and Consuming Countries as of the2nd Semester 2019.
World Pepper Export as of the2nd Semester 2019
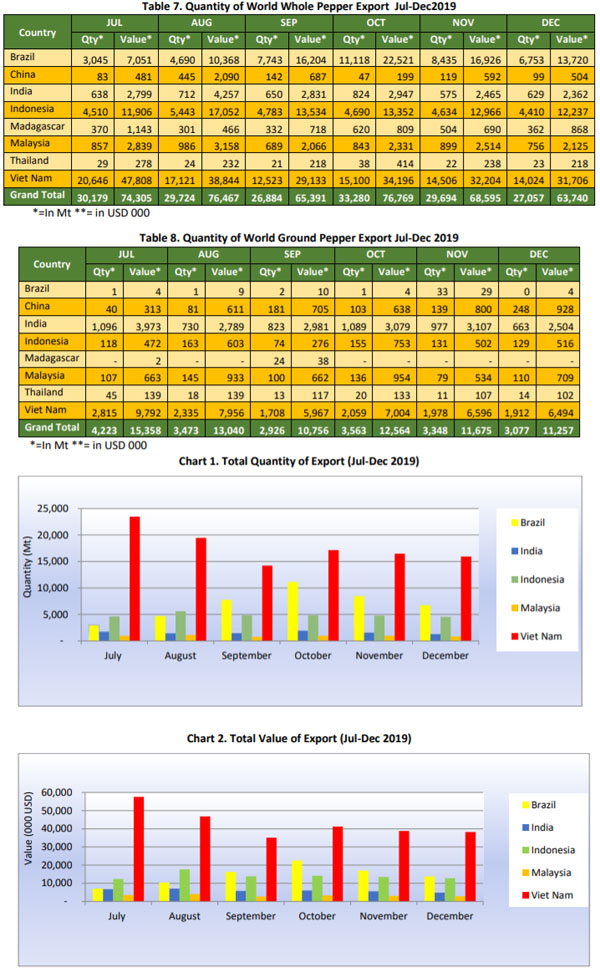
World pepper export from pepper producing origins as of July-December 2019 fluctuated with a total of 197,427 Mt. Thus, recording a 24% decrease when compared to the 1st semester of 2019 which amounted to 259,922 Mt (read Market Report October edition). The highest export was reported in October 2019 with 36,843 Mt whilst the lowest export occurred in September which only reached 29,810 Mt. From July to December 2019 pepper export from pepper producing origins recorded a decrease of 12% which amounted to 30,133 Mt (Table 7). As for the 2nd semester of 2019 the top three pepper exporters were Viet Nam with 106,727 Mt or 54% of the world total export for the 2nd semester of 2019, followed by Brazil with 41,824 Mt or 21% of the world total export and Indonesia with 29,240 Mt or 15% of the world total export.
Viet Nam
During the 2nd semester of 2019, Viet Nam was reported to have exported a total of 106,727Mt which comprised of 88% or 93,920 Mt of whole pepper and 12% or 12,807 Mt of ground pepper. Thus, recording a staggering 40% decrease when compared with the achievement of the 1st semester. Pepper export from Viet Nam during the 2nd semester 2019 fluctuated with an average export of pepper amounted to Mt 17,788 per month with the highest export was reported in July with 23,461 Mt while the lowest export occurred in September with 14,231 Mt. The highest figure of Viet Nam pepper export in July could be contributed to the high stock following the end of harvest in May. The highest increase of pepper export by Viet Nam was reported to have occurred in October with an increase of 21% or 2,928 Mt as compared with the previous month. In December 2019, Viet Nam exported a total of 15,936 Mt, thus recording a decrease of 32% or 7,525 Mt as compared with July. As for the 2nd semester 2019, Viet Nam's total revenue from pepper export was reported to be as high as USD 257.7 Million, recording a significant 43% deficit when compared to the 1st semester of 2019.
Furthermore, during the 2nd semester of 2019, Viet Nam's top 5 Country destinations for its pepper were reported to be United States of America with 22,636 Mt (a decrease of 15% when compared with the 1st semester of 2019), China with 12,056 Mt (a decrease of 73%) (many cross border and undocumented trade), India with 6,094 Mt (a decrease of 56%), Germany with 3,843 Mt (a decrease of 44%) and United Arab Emirates with 3,563 Mt (a decrease of 48%).
Brazil
In the 2nd semester of 2019, Brazil was reported to have exported a total of 41,824 Mt which comprised of 99.9% or 41,786 Mt of whole pepper and 0.1% or 39 Mt of ground pepper, recording a slight 2% decrease when compared to the 1st semester of 2019. Pepper export from Brazil during the 2nd semester 2019 fluctuated with an increasing trend, averaging at Mt 6,971 per month of which the highest export was reported in October with 11,119 Mt while the lowest export occurred in July with 3,046 Mt. The highest increase of pepper export by Brazil occurred in September with an increase of 65% or 3,055 Mt as compared with the previous month. In December 2019, Brazil exported a total of 6,754 Mt, thus recording an increase of 122% or 3,707 Mt when compared with July 2019. As for the 2nd semester of 2019, Brazil's total revenue from pepper export was reported to be as high as USD 86.8 Million. Thus, recording a 6% deficit as compared to the 1st semester of 2019.
Furthermore, during the 2nd semester of 2019, Brazil's top 5 Country destinations for its pepper were reported to be Viet Nam with 10,076 Mt (an increase by 5,548 Mt when compared with the 1st semester of 2019), Germany with 6,940 Mt (an increase of 36%), United States of America with 3,638 Mt (a decrease of 26%), India with 2,802 Mt (an increase of 36%) and Egypt with 2,642 Mt (an increase of 1%).
Indonesia
During the 2nd semester of 2019, Indonesia was reported to have exported a total of 29,240 Mt which comprised of 97% or 28,470Mt of whole pepper and 3% or 770 Mt of ground pepper. Thus, recording a significant increase of 30% when compared with the 1st semester of 2019. Pepper export from Indonesia during the 2nd semester 2019 fluctuated, averaging to 4,873 Mt per month of which the highest export was reported in August with 5,606 Mt while the lowest export occurred in December with 4,539 Mt. The high figure of Indonesia pepper export in August could be contributed that Indonesia's harvest of pepper occurs during August-October. The highest increase of pepper export by Indonesia occurred in August with an increase of 21% or 977 Mt as compared with the previous month. In December 2019, Indonesia exported a total of 4,539 Mt, thus recording a decrease of 2% or 90 Mt as compared with July 2019. As for the 2nd semester 2019, Indonesia's total revenue from pepper export was reported to be as high as USD 84.1 Million, recording a significant 33% increase when compared with the 1st semester of 2019.
Furthermore, in the 2nd semester of 2019, Indonesia's top 5 Country destinations for its pepper were reported to be Viet Nam with 9,756 Mt (a decrease of 17% when compared with the 1st semester of 2019), China with 5,904 Mt (an increase by 5,119 Mt), India with 3,595 Mt (an increase of 47%), United States of America with 2,765 Mt (an increase of 27%) and Germany with 1,694 Mt (an increase by 1,081 Mt).
India
In the 2nd semester 2019, India was reported to have exported a total of 9,408 Mt which comprised of 43% or 4,029 Mt of whole pepper and 57% or 5,379 Mt of ground pepper, recording a 4% decrease when compared with the 1st semester of 2019. Pepper export from India during the 2nd semester of 2019 fluctuated with decreasing trend, averaging at 1,568 Mt per month with the highest export was reported in October with 1,913 Mt while the lowest export occurred in December with 1,292 Mt.The highest increase of pepper export by India occurred in October with an increase of 30% or 440 Mt as compared with the previous month. In December 2019, India exported a total of 1,292 Mt, thus recording adecrease of 26% or 443 Mt as compared with July 2019. As for the 2nd semester 2019, India's total revenue from pepper export was reported to be as high as USD 36.0 Million. Thus, recording 17% loss when compared with the 1st semester 2019.
Furthermore, during the 2nd semester of 2019, India's top 5 Country destinations for its pepper were reported to be United States of America with 3,472 Mt (a decrease of 4% when compared with the 1st semester of 2019), United Kingdom with 685 Mt (a decrease of 3%), Canada with 581 Mt (an increase of 35%), Sweden with 453 Mt (a decrease of 9%) and Spain with 348 Mt (a decrease of 52%).
Malaysia
During the 2nd semester of 2019, Malaysia was reported to have exported a total of 5,707 Mt which comprised of 88% or 5,030 Mt of whole pepper and 12% or 677 Mt of ground pepper. Thus, recording a significant increase of 37% when compared with the 1st semester of 2019. Pepper export from Malaysia during the 2nd semester 2019 fluctuated, averaging at 951 Mt per month with the highest export was reported in August with 1,131 Mt while the lowest export occurred in September with 789 Mt. The highest increase of pepper export by Malaysia occurred in October with an increase by 24% or 190 Mt as compared with the previous month. In December 2019, Malaysia exported a total of 866 Mt, thus recording a decrease of 10% or 99 Mt when compared with July 2019. As for the 2nd semester 2019, Malaysia's total revenue from pepper export was reported to be as high as USD 19.4 Million, recording a 24% increase when compared with the 1st semester of 2019.
In addition, in the 2nd semester of 2019, Malaysia's top 5 Country destinations for its pepper were reported to be Japan with 2,090 Mt (an increase of 39% when compared with the 1st semester of 2019), China with 951 Mt (a decrease of 9%), Viet Nam with 690 Mt (an increase by 559 Mt), Taiwan with 674 Mt (an increase of 35%) and South Korea with 487 Mt (an increase by 339 Mt).
Madagascar
During the 2nd semester of 2019, Madagascar was reported to have exported a total of 2,514 Mt which comprised of 99% or 2,490 Mt of whole pepper and 1% or 24 Mt of ground pepper. Thus, recording an increase by 1,333 Mt when compared with the 1st semester of 2019. Pepper export from Madagascar during the 2nd semester 2019 fluctuated, averaging at Mt 419 Mt per month with the highest export was reported in October with 620 Mt while the lowest export occurred in August with 301 Mt. The highest increase of pepper export by Madagascar occurred in October with an increase by 74% or 264 Mt as compared with the previous month. In December 2019, Madagascar exported a total of 362 Mt, thus recording a decrease of 2% or 7 Mt as compared with July 2019. As for the 2nd semester 2019, Madagascar's total revenue from pepper export was reported to be as high as USD 4.7 Million, recording a total increase by USD 2.3 Million when compared with the 1st semester 2019.
Furthermore, in the 2nd semester of 2019, Madagascar's top 5 Country destinations for its pepper were reported to be Sudan with 289 Mt (an increase by 194 Mt when compared with the 1st semester 2019), United Arab Emirates with 281 Mt (an increase of 77%), Pakistan with 260 Mt (an increase by 204 Mt), Egypt with 251 Mt (an increase by 223 Mt) and France with 237 Mt (an increase of 56%).
China
In the 2nd semester of 2019, China was reported to have exported a total of 1,727 Mt which comprised of 54% or 935 Mt of whole pepper and 46% or 792 Mt of ground pepper, recording a major increase of 80% when compared with the 1st semester of 2019. Pepper export from China during the 2nd semester 2019 fluctuated, averaging at 288 Mt per month with the highest export recorded in August with 526 Mt while the lowest export occurred in July with 123 Mt. The highest increase of pepper export by China occurred in August with an increase by 403 Mt as compared with the previous month. In December 2019, China exported a total of 347Mt, thus recording an increase by 224 Mt as compared with July 2019. As for the 2nd semester 2019, China's total revenue from pepper export was reported to be as high as USD 8.5 Million. Thus, recording a 33% increase as compared with the 1st semester of 2019.
Furthermore, in the 2nd semester of 2019, China's top 5 Country destinations for its pepper were reported to be Germany with 720 Mt (an increase by 615 Mt when compared with the 1st semester of 2019), North Korea with 195 Mt (a decrease of 39%), United States of America with 187 Mt (an increase of 48%), Hong Kong with 171 Mt (an increase of 26%) and Australia with 72 Mt (an increase by 49 Mt).
Thailand
In the 2nd semester of 2019, Thailand was reported to have exported a total of 279 Mt which comprised of 57% or 158 Mt of whole pepper and 43% or 121 Mt of ground pepper, recording a spike of 7% as compared with the 1st semester of 2019. Pepper export from Thailand during the 2nd semester 2019 fluctuated, averaging at 47 Mt per month with the highest export was reported in July with 74 Mt while the lowest export occurred in November with 33 Mt. The highest increase of pepper export by Thailand occurred in October with an increase of 70% or 24 Mt as compared with the previous month. In December 2019, Thailand exported a total of 37 Mt, thus recording a decrease of 49% or 36 Mt as compared with July 2019. As for the 2nd semester 2019, Thailand's total revenue from pepper export was reported to be as high as USD 2.3 Million, recording a loss by 6% as compared with the 1st semester of 2019.
Furthermore, in the 2nd semester of 2019,Thailand's top 5 Country destinations for its pepper were reported to be South Africa with 127 Mt (an increase of 16% when compared with the 1st semester of 2019),United States of America with 39 Mt (a decrease of 22%), Myanmar with 34 Mt (an increase by 32 Mt), New Zealand with 10 Mt (an increase of 43%) and South Korea with 8 Mt (an increase by 6 Mt).
World Pepper Import of the 2nd Semester 2019
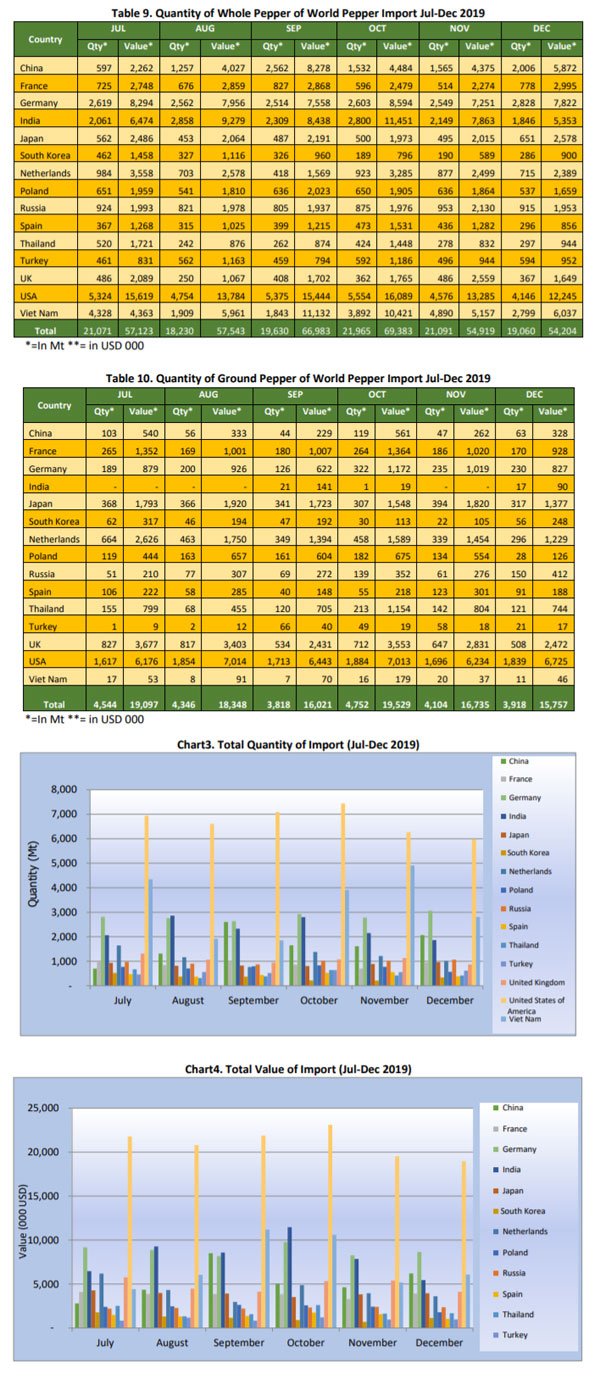
World pepper import of consuming countries during the 2nd semester of 2019 fluctuated with a total of 146,528 Mt, recording a 3% increase when compared with the 1st semester of 2019. The highest import was reported in October 2019 with 26,716 Mt whilst the lowest import occurred in August with only 22,576 Mt. During the 2nd semester of 2019, the top five pepper importer were United States of America with 40,331 Mt or 28% of the world total import, followed by Viet Nam with 19,740 Mt or 13% of the world total import, Germany with 16,977 Mt or 12% from world total import, India with 14,062 Mt or 10% from world total import and Netherlands with 7,189 Mt or 5% from world total import. However, based on mirror data taken from China counterpart, as for the 2nd semester of 2019 China had imported a total of 19,072 Mt which would make China the third biggest pepper importer for the 2nd semester of 2019 with 13% share of the world total import.
United States of America
In the 2nd semester of 2019, United States of America was reported to have imported a total of 40,331 Mt which comprised of 74% or 29,729 Mt of whole pepper and 26% or 10,602 Mt of ground pepper. Thus, recording an 8% decrease when compared with the 1st semester of 2019. Pepper imported by United States of America during the 2nd semester 2019 fluctuated, averaging at 6,722 Mt per month with the highest import was reported in October with 7,438 Mt while the lowest occurred in December with 5,984 Mt. The highest increase of pepper import by United States of America occurred in September with an increase by 7% or 481 Mt as compared with the previous month. In December 2019, United States of America imported a total of 5,984 Mt, thus recording a decrease of 14% or 956 Mt as compared with July 2019. As for the 2nd semester of 2019, United States of America's total expenditure of pepper import was reported to be as high as USD 126.0 Million, spending 12% less when compared with the 1st semester of 2019.
Furthermore, during the 2nd semester of 2019, United States of America's top 5 origin countries for its pepper were reported to be Viet Nam with 27,611 Mt (a decrease of 4% when compared with the 1st semester of 2019), Brazil with 4,058 Mt (a decrease of 37%), India with 3,885 Mt (an increase of 13%), Indonesia with 2,550 Mt (a decrease of 6%) and Ecuador with 1,217 Mt (an increase by 706 Mt).
Germany
During the 2nd semester of 2019, Germany was reported to have imported a total of 16,977 Mt which comprised of 92% or 15,675 Mt of whole pepper and 8% or 1,302 Mt of ground pepper. Thus, recording a spike of 3% as opposed to the 1st semester of 2019. Pepper imported by Germany during the2nd semester of 2019 fluctuated, averaging at 2,830 Mt per month with the highest import was reported in December with 3,058 Mt while the lowest import occurred in September with 2,640 Mt. The highest increase of pepper import by Germany occurred in October with an increase by 11% or 285 Mt as compared with the previous month. In December 2019, Germany imported a total of 3,058 Mt, recording an increase of 9% or 250 Mt as compared to July 2019. As forthe 2nd semester of 2019, Germany's total expenditure of pepper import was reported to be as high as USD 52.9 Million, spending 5% less when compared to the 1st semester of 2019.
Furthermore, during the 2nd semester of 2019, Germany's top 5 origin countries for its pepper were reported to be Brazil with 7,357 Mt (an increase of 5% when compared with the 1st semester of 2019), Viet Nam with 5,694 Mt (a decrease of 8%), Indonesia with 1,864 Mt (an increase of 88%), Cambodia with 770 Mt (an increase by 466 Mt) and India with 498 Mt (a decrease of 29%).
Viet Nam (Mirror Data)
During the 2nd semester of 2019, Viet Nam was reported to have imported a total of 19,740 Mt which comprised of 99.6% or 19,661 Mt of whole pepper and 0.4% or 79 Mt of ground pepper, recording a 13% decrease when compared with the 1st semester of 2019. Pepper imported by Viet Nam during the 2nd semester 2019 fluctuated averaging at 3,290 Mt per month with the highest import was reported in November 2019 with 4,910 Mt while the lowest import occurred in September with 1,850 Mt. The highest increase of pepper import by Viet Nam occurred in October with an increase by 2,058 Mt as compared with the previous month. In December 2019, Viet Nam imported a total of 2,810 Mt, recording a decrease of 35% or 1,535 Mt as compared with July 2019. As for the 2nd semester of 2019, Viet Nam's total expenditure of pepper import was estimated to be as high as USD 43.5 Million.
Furthermore, in the 2nd semester of 2019, Viet Nam's top 5 origin countries for its pepper were reported to be Indonesia with 12,028 Mt (an increase of 8% as compared with the 1st semester of 2019), Brazil with 6,727 Mt (a decrease of 25%), Cambodia with 574 Mt (a decrease of 59%), Malaysia with 286 Mt (an increase of 77%) and India with 11 Mt (a decrease of 91%).
India
During the 2nd semester of 2019, India was reported to have imported a total of 14,062 Mt which comprised of 99.7% or 14,023 Mt of whole pepper and 0.3% or 39 Mt of ground pepper, recording a decrease of 9% when compared with the 1st semester of 2019. Pepper imported by India during the 2nd semester 2019 fluctuated, averaging at 2,344 Mt per month with the highest import was reported in August with 2,858 Mt while the lowest import occurred in December with 1,863 Mt. The highest increase of pepper import by India occurred in August with an increase of 39% or 797 Mt as compared with the previous month. In December 2019, India imported a total of 1,863 Mt, recording a decrease of 10% or 198 Mt as compared with July 2019. As for the 2nd semester of 2019, India's total expenditure of pepper import was reported to be as high as USD 49.1 Million, recording a spike of 10% when compared to the 1st semester of 2019.
Furthermore, in the 2nd semester of 2019, India's top 5 origin countries for its pepper were reported to be Viet Nam with 4,874 Mt (a drop of 41% as compared with the 1st semester of 2019), Sri Lanka with 3,695 Mt (an increase by 2,156 Mt), Indonesia with 3,094 Mt (an increase of 4%), Brazil with 1,574 Mt (a drop of 28%) and Ecuador with 565 Mt (an increase of 57%).
Netherlands
During the 2nd semester of 2019, Netherlands was reported to have imported a total of 7,189 Mt which comprised of 64% or 4,620 Mt of whole pepper and 36% or 2,569 Mt of ground pepper. Thus, recording a drop of 10% when compared with the 1st semester of 2019. Pepper imported by Netherlands during the 2nd semester 2019 fluctuated, averaging at 1,198 Mt per month with the highest import was reported in July with 1,648 Mt while the lowest import occurred in September with 767 Mt. The highest increase of pepper import by
Netherlands occurred in October with an increase by 80% or 614 Mt as compared with the previous month. In December 2019, Netherlands imported a total of 1,011 Mt, recording a decrease of 39% or 637 Mt as compared with July 2019. As for the 2nd semester 2019, Netherland's total expenditure of pepper import was reported to be as high as USD 25.9 Million, spending 15% less as compared to the 1st semester of 2019.
Furthermore, in the 2nd semester of 2019, Netherlands' top 5 origin countries for its pepper were reported to be Viet Nam with 3,754 Mt (an increase of 4% as compared to the 1st semester of 2019), Brazil with 1,242 Mt (a drop of 45%), Indonesia with 686 Mt (a decrease of 18%), Ecuador with 484 Mt (an increase by 405 Mt) and Spain with 311 Mt (an increase of 10%).
China (Mirror Data)
During the 2nd semester of 2019, China was reported to have imported a total of 19,072 Mt, recording a drop by 58% when compared with the 1st semester of 2019 which was reported at 45,838 Mt. Pepper import of China during the 2nd semester of 2019 fluctuated, averaging at 3,179 Mt per month with the highest import was reported in July 2019 with 6,746 Mt while the lowest import recorded in October with 1,872 Mt.
Most of China's pepper were reported to come from Viet Nam with 12,056 Mt for the 2nd semester of 2019 which amounted to 63% of the total pepper imported by China. Thus, recording a decrease of 73% of China import from Viet Nam as compared to the 1st semester of 2019 which amounted to 45,467 Mt.
Source:
- Brazil, Unofficial source (Coreimex, CSG Trade)
- India: AISEF, NCDEX, Indian Chamber of Commerce & Industry, Spices Board India
- Indonesia: Unofficial source
- Malaysia: Malaysian Pepper Board
- Sri Lanka: Department of Export Agriculture
- Viet Nam : Viet Nam Pepper Association, HCMC
- China: Hainan Pepper Association, China Spice Association
- Office of Agricultural Economics of Thailand
- A.A. SAYIA & Company
- International Trade Centre (ITC) - Geneva
Note: Some of the data in this publication are from the IPC database. The data are obtained from official reports and correspondence between the IPC and Sri Lanka and have been processed based on statistical norms that can be accounted for.
Previous Publications
- Market Review - July 2015
- Market Review - June 2015
- Market Review - May 2015
- Market Review - April 2015
- Market Review - March 2015
- Market Review - February 2015
- Market Review - January 2015
- MARKET REPORT 2014
- Market Review - November 2014
- Market Review - October 2014
- Market Review - September 2014
- Market Review - July 2014
- Market Review - June 2014
- Market Review - April 2014
- Market Review - February 2014
- Market Review - December 2013
- Market Review - November 2013
- Market Review - August 2013
- Market Review - June & July 2013
- Market Review - May 2013
- Market Review - April 2013
- Market Review - March 2013
- Market Review - February 2013
- MARKET REVIEW 2012
- Market Review - November 2012