a UNESCAP Intergovermental Organization
a UNESCAP Intergovermental Organization
Quarterly Publication
Global Pepper Report - First Half January to June FY 2025
A. Key statistics
A. 1 Exports from Key Origins
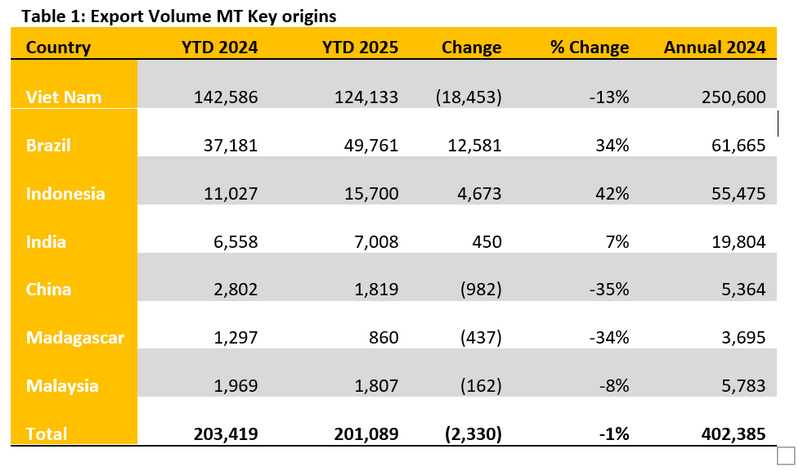
Globally, the estimated annual production of pepper ranges between 550,000 and 600,000 metric tons (MT), with international trade volumes accounting for approximately 400,000 to 450,000 MT per year. The discrepancy is largely attributed to substantial domestic consumption by producing countries, such as India and Indonesia, where local industries and markets absorb a significant portion of the harvest.
During the first half of 2025, total exports from the major producing countries amounted to approximately 201,000 MT, virtually on par with the same period in 2024. However, this apparent stability at the aggregate level conceals noteworthy shifts in country-level performance and trade behavior.
Market dynamics during this period were shaped significantly by inter-origin arbitrage opportunities. As a result, destination markets adjusted sourcing strategies in response to price differentials, shipping timelines, and bilateral preferences, leading to measurable changes in the origin composition of exports.
Vietnam, historically the dominant exporter, recorded a notable decline of 18,453 MT (-13%) in its year-to-date (YTD) exports. This reduction, however, was offset by increases from Brazil and Indonesia, which expanded their shipments by 12,581 MT (+34%) and 4,673 MT (+42%), respectively.
Taken together, this redistribution of export volumes effectively balanced the overall global supply outflow during the first half of the year, maintaining continuity in trade despite origin-level fluctuations.
Insight: The data suggests the emergence of a more diversified and adaptive global pepper trade architecture. The increasing share of exports from Brazil and Indonesia, traditionally secondary players relative to Vietnam, indicates a gradual shift toward a multi-origin, multi-polar supply structure. This evolution enhances systemic resilience but also introduces new variables in terms of quality consistency, logistics coordination, and pricing power. Stakeholders may need to recalibrate risk assessments and sourcing strategies accordingly.
A.2 Net Exports from Origins
The net exports (Exports- Imports) would depict a better picture in terms of the inventory situation at the origin.
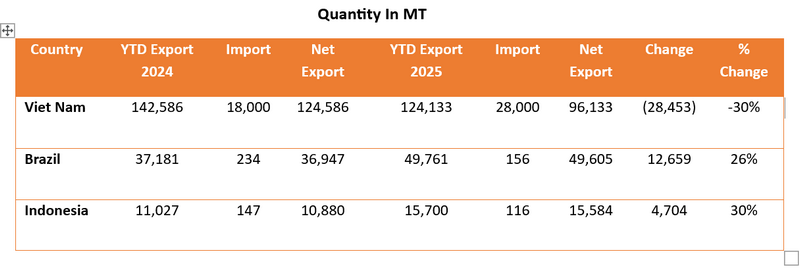
Viet Nam concluded its harvest cycle in early 2025 with reported yields at par with seasonal expectations. However, net exports for the first half of the year declined significantly, by approximately 28,453 metric tons, representing a 30% year-on-year contraction compared to the same period in 2024. Given the stable harvest volume, this suggests a substantial volume of pepper remains within the domestic supply chain, either committed under deferred contracts or held by growers, collectors, and intermediaries in anticipation of more favorable market conditions.
This situation aligns with broader shifts in global trade behavior, wherein exporters, particularly in Vietnam, are increasingly avoiding short positions amidst rising macroeconomic uncertainty, including tariff adjustments, ongoing geopolitical tensions, and ample inventory levels at destination markets. Consequently, buyers have adopted a more cautious and opportunistic approach, characterized by short-term, price-sensitive procurement strategies. Purchasing activity tends to increase during price corrections but slows down quickly when prices rebound, leading to irregular and highly timing-sensitive shipment flows.
Insight: Viet Nam’s lower net export performance in the first half of 2025, despite a favourable harvest, may reflect a strategic inventory positioning in response to evolving market conditions. The presence of carryover stocks suggests a degree of supply flexibility in the months ahead, which could play a stabilizing role in meeting global demand, particularly if market conditions tighten or price volatility persists.
Brazil, on the other hand, registered a robust increase in its export performance during the first half of 2025, driven primarily by favourable price arbitrage opportunities. This elevated outflow is not reflective of surplus stockholding; rather, it represents a responsive trade posture that capitalized on elevated international prices, especially during periods when Vietnamese offers were limited or delayed. Notably, in June 2025, while Vietnam’s prices experienced a significant downward correction, Brazilian export prices remained relatively stable, suggesting minimal available inventory and strong destination-specific demand.
Additionally, trade flows between Brazil and Vietnam, a route often indicative of origin-based re-export activity, have been virtually dormant over the past two months. This further reinforces the assumption of tight domestic stock levels in Brazil. The upcoming harvest, primarily concentrated in the northern regions, is expected to commence in September 2025, with forward offers already circulating for the September–December delivery window.
Indonesia also experienced an impressive increase in export volumes, with a 30% year-on-year rise during the first half of 2025. Much of this outbound flow occurred in Q1, with notable shipments recorded to Viet Namand the United States, based on trade flow patterns observed in recent quarters. The pepper supplied originated from Indonesia’s 2024 harvest, with favourable market pricing conditions prompting aggressive sales and early contract fulfillment. Similar to Brazil, Indonesia is currently understood to be operating with limited exportable inventory, as domestic demand remains strong and internal absorption continues to rise.
Insight: The distinct export patterns observed among Brazil, Indonesia, and Viet Namin the first half of 2025 underscore the complementary roles these origins play in shaping global pepper supply. While Brazil and Indonesia responded promptly to favourable market signals through timely shipments, Viet Namcontributed stability by pacing its exports in alignment with broader demand dynamics. These varied approaches reflect the unique domestic contexts, harvest cycles, and internal market characteristics of each origin. In combination, such diversity enhances the resilience of global supply and offers buyers a balanced mix of responsiveness and reliability, an asset for the pepper trade in navigating the uncertainties of the second half of the year.
A.3 Imports
Top global importers and major consuming destinations recorded solid pepper inflows during the first half of 2025, suggesting that many markets may now be sufficiently stocked for the near term. While some exceptions remain, notably in markets such as Pakistan, overall import activity reflects a cautious yet confident purchasing stance among buyers. In the case of India, where imports are primarily destined for re-export as processed products, the lower import volume may indicate that procurement needs were either met earlier or sourced through alternative channels.
The table below compares import volumes between the first half of 2024 and 2025:
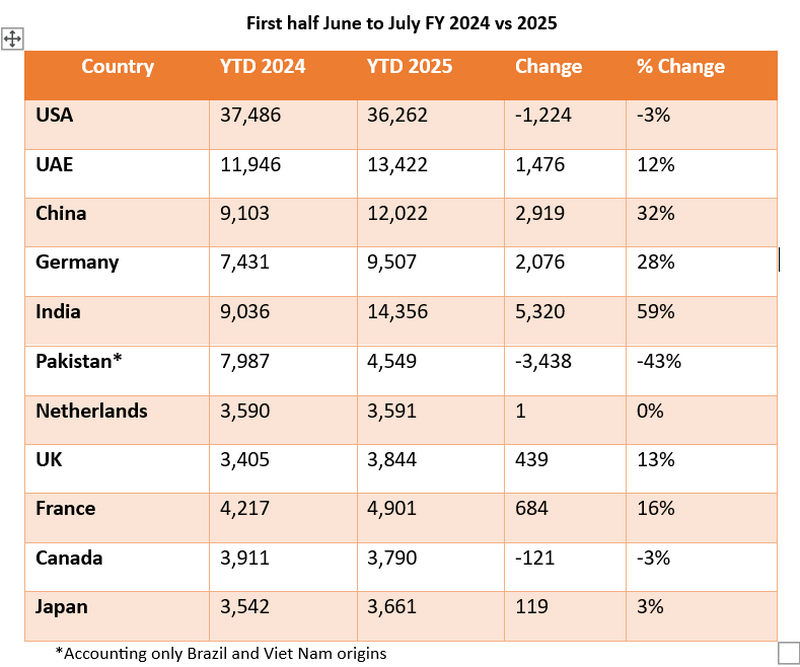
According to the table, a review of import trends for the first half of 2025 reveals evolving consumption patterns and adaptive sourcing strategies across major pepper-importing markets. India, China and Germany led growth with notable year-on-year increases of 59%, 32% and 28%, respectively, figures that likely reflect a mix of strategic stockbuilding and strong industrial demand, particularly in food processing sectors. The United Arab Emirates, France, and the United Kingdom also posted double-digit growth, indicating renewed market confidence and successful utilization of favorable pricing windows.
In contrast, Pakistan recorded significant declines 43%. These reductions may be linked to internal adjustments such as carryover inventories, changing dynamics in re-export strategies, or broader macroeconomic pressures affecting trade capacity.
Meanwhile, the United States, despite registering a modest 3% dip, remained the world’s largest importer by volume, suggesting that stable demand continues to be supported by earlier inventory coverage and cautious procurement behavior. Import levels in the Netherlands and Japan remained largely unchanged, underscoring long-term procurement planning and consistent domestic absorption.
These import trends must also be seen in the context of broader market behavior observed during the reporting period. In the early months of 2025, global import activity was relatively subdued, reflecting a wait-and-see stance among buyers amidst price volatility and geopolitical uncertainties. However, a notable shift occurred in May and June, when international prices softened and triggered renewed buying interest. This change in momentum led to a surge in shipments across several destinations, with Viet Namalone dispatching approximately 25,000 metric tons in June, an indicator of renewed purchasing activity and active inventory replenishment at the destination level.
Taken together, these developments illustrate the increasing complexity and responsiveness of the global pepper trade. Markets are no longer driven solely by baseline consumption but are instead shaped by an interplay of strategic timing, risk mitigation, and destination-specific procurement logic. As such, import behaviors in the first half of 2025 offer valuable signals for anticipating trade patterns, price dynamics, and origin-destination relationships in the months to come.
In brief: As of mid-2025, Viet Nam’s lower net exports have contributed to relatively high domestic inventory levels, offering potential supply flexibility in the months ahead. In contrast, both Indonesia and Brazil, despite currently operating with limited stock, are expected to begin their main harvests in August and September, respectively. The convergence of these supply dynamics may lead to more active market engagement from all three major origins, potentially increasing competitive offerings in the global market during the second half of the year.
B. Price Movement
Black Pepper (ASTA 570, FOB, USD/MT) over the 6 months, Jan to June 2025.
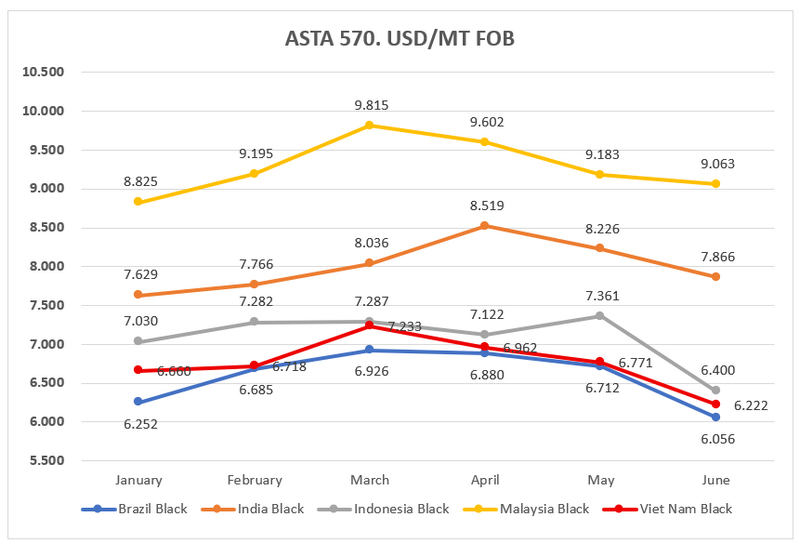
A review of black pepper price trends from January to June 2025 across key producing origins highlights a diverse and evolving market landscape, influenced by varying supply cycles, trade strategies, and buyer sentiment.
Malaysia consistently commanded the highest price levels throughout the period, beginning at USD 8,825/MT in January and reaching a peak of USD 9,815/MT in March. Although a slight easing followed in the second quarter, prices remained firm at USD 9,063/MT by June. This pattern may reflect tight exportable stocks and strong demand from destinations, particularly during periods of limited availability from other origins.
India followed a similarly upward trend, with prices rising steadily from USD 7,629/MT in January to a high of USD 8,519/MT in April before moderating slightly to USD 7,866/MT in June. The trajectory suggests stable demand underpinned by India’s role as a key processor and exporter of value-added pepper products.
Indonesia experienced a measured increase in prices during the first half of the year, supported by Q1 trade flows and favourable pricing. A peak of USD 7,361/MT was recorded in May, followed by a notable correction to USD 6,400/MT in June. This adjustment may be linked to market recalibration ahead of the upcoming harvest and increased availability from competing origins.
Brazil and Viet Nam displayed comparable pricing trends, with moderate gains observed through the early months of 2025, followed by gradual softening toward mid-year. Both countries converged to the USD 6,200–6,400/MT range in June, signalling a period of relative stabilization amid broader market adjustments.
In summary, the first half of 2025 was characterized by firm pricing in Q1, driven by tight stocks and active demand, followed by a gentle retreat in Q2 as buyers reassessed procurement strategies in anticipation of new crop supplies. The varying degrees of price resilience across origins underscore the growing complexity of the global pepper trade, where origin-specific conditions, perceived quality, and forward-looking expectations increasingly shape market behavior.
White Pepper Price Movement over the 6 months, Jan to June 2025.
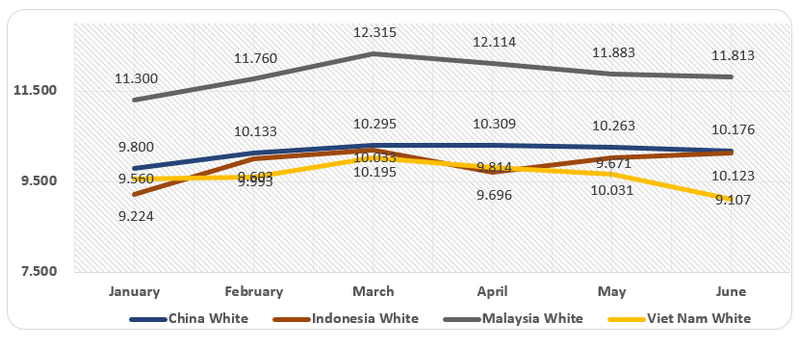
During the first half of 2025, the average FOB prices for white pepper across key origins exhibited moderate fluctuations, shaped by a blend of domestic harvest cycles, export behavior, and global buyer sentiment.
Malaysia consistently posted the highest prices, ranging from USD 11,300/MT in January to a peak of USD 12,315/MT in March, before settling at USD 11,813/MT in June. This trajectory reflects the country’s sustained position in the premium quality segment and continued strength in niche markets.
Indonesia showed early strength in Q1, with prices rising from USD 9,224/MT in January to USD 10,195/MT in March, signalling robust initial shipments and responsive domestic demand. The following months showed a minor dip to USD 9,696 in April, then steadied back above USD 10,000/MT through June (USD 10,123/MT), suggesting stable market recalibration.
China\'s average prices moved from USD 9,800/MT in January to a modest peak of USD 10,309/MT in April, before a slight softening to USD 10,176/MT by June, reflecting balanced internal and export-oriented trade behavior.
Viet Nam experienced gradual price gains from USD 9,560/MT in January to USD 9,814/MT in April, then adjusted to USD 9,107/MT in June, possibly influenced by inventory turnover and shipment timing.
These differentiated price patterns highlight the interplay between origin-level strategies, market timing, and demand responsiveness. As the global white pepper trade matures, agility in aligning supply with evolving buyer signals and macroeconomic cues is likely to be as critical as production volume itself.
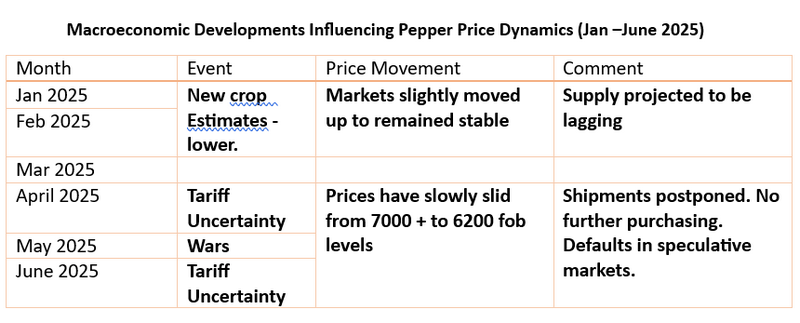
The global pepper market during the first half of 2025 was significantly influenced by a convergence of macroeconomic developments, policy uncertainty, and evolving trade dynamics. These factors collectively shaped price behavior, export volumes, and import responses across regions.
In January and February, downward revisions in new crop estimates from several producing countries sparked market anticipation of tighter supply. This sentiment provided modest price support, as reflected in relatively stable or upward movements in FOB prices across major origins such as Brazil, India, and Indonesia. Importers responded with measured procurement strategies, building inventories selectively, especially in markets like India, China, Germany, and the UAE, which later registered double-digit growth in year-on-year import volumes.
As the calendar advanced into April and May, market sentiment began to shift. Growing concerns over tariff uncertainties and broader geopolitical tensions, as noted in key macro events, contributed to a softening in prices. Black pepper prices, for example, gradually declined from above USD 7,000/MT to approximately USD 6,400/MT by June, as illustrated in the price movement charts (Brazil). This price correction coincided with intensified export activity, particularly from Viet Nam, which shipped out around 26,000 metric tons in May alone, indicating that several exporters seized the opportunity to clear inventory while prices remained commercially viable.
Simultaneously, this price dip triggered cautious yet opportunistic buying patterns among key importing countries. While the United States, the largest importer by volume, registered a slight year-on-year decline, India, China and Germany saw significant increases in imports, reflecting both strategic stockpiling and demand resilience. In contrast, Pakistan scaled back purchases, likely influenced by domestic factors such as carryover stocks, crop substitution, or external trade constraints.
By June, continued macroeconomic ambiguity, including prolonged tariff discussions, led to more selective procurement behaviour. This sentiment was reflected in the steady decline of white pepper prices from Viet Nam and China, as shown in the white pepper price trend chart, even as Indonesia maintained moderate price stability.
Insight: The interplay between macroeconomic developments, price movements, and trade flows reflects the increasing sophistication and responsiveness of the global pepper market. Supply-side adjustments observed in the first half of 2025, including variations in shipment timing and export pace, highlight the efforts of producing countries to align with evolving market dynamics. On the demand side, import patterns show a range of approaches, from timely restocking to more measured purchasing, influenced by both internal market considerations and broader external conditions. Looking ahead, sustained competitiveness in the pepper sector will likely depend on the ability of stakeholders to anticipate global trends, manage supply chain uncertainty, and respond with agility to changing signals in both production and consumption landscapes.
C. Origin-wise Supply Situation
Viet Nam: Reports from Viet Nam indicate that the 2025 crop was generally favourable, with the harvest completed by April. Early signs of the ongoing monsoon season suggest positive flowering, and preliminary expectations for the 2026 crop appear encouraging, assuming conducive weather conditions persist. Nonetheless, extended heatwaves could present challenges to plant vitality and impact yield formation.
Indonesia: Initial observations point to a decline in crop output, with estimates from certain trade participants indicating a reduction of up to 30%. Harvesting is anticipated to begin from late July to mid-August. While export flows are likely to resume during this period, robust domestic consumption may moderate the volume of stock available for international markets, which in turn could influence pricing stability.
Brazil: The northern crop is expected to commence in September, with many shippers preparing to begin offering from that period onwards. Reported inventory levels are currently limited, reflecting steady prior exports. This cycle may see a renewed phase of export engagement once harvesting picks up.
September to December Outlook: As Viet Nam’s net exports experienced a noticeable decline in the earlier part of the year, inventory availability may improve moving forward. With Indonesia and Brazil approaching their respective peak harvests, the second half of 2025 may witness more active participation from all three key origins in export markets.
Insight: The evolving supply outlook among major origins, such as Viet Nam, Indonesia, and Brazil, highlights the growing importance of seasonal timing, domestic absorption, and weather-related factors in shaping the global pepper trade. Viet Nam, having completed its harvest earlier in the year, appears to have front-loaded much of its export activity in the first half, while Indonesia and Brazil are entering their respective harvest phases, potentially contributing to greater availability in the coming months. As these seasonal dynamics unfold, the second half of 2025 may witness more active participation across origins, not solely influenced by production volume, but also by the ability to align shipments with market needs and policy environments. Moving forward, the capacity of producing countries to navigate this complex landscape with adaptability and informed responsiveness will be instrumental in sustaining their market relevance.
Sources:
|
Previous Publications
- GLOBAL PEPPER MARKET REPORT ANNUAL REVIEW 2025 AND OUTLOOK 2026
- Global Pepper Report - First Half January to June FY 2025
- GLOBAL PEPPER INDUSTRY SEMESTERLY REPORT
- GLOBAL PEPPER INDUSTRY 3RD QUARTERLY REPORT (JULY - OCTOBER 2022)
- WORLD PEPPER INDUSTRY 2ND QUARTERLY REPORT (JAN -JUNE 2022)
- 1st Quarterly 2022 Report
- 3rd Quarterly 2021 Report
- 2nd Quarterly 2021 Report
- 1st Quarterly 2021 Report
- 4th Quarterly 2020 Report
- 3rd Quarterly 2020 Report
- 2nd Quarterly 2020 Report
- 1st Quarterly 2020 Report
- 4th Quarterly 2019 Report
- 3rd Quarterly 2019 Report
- 2<sup>nd</sup> Quarterly 2019 Report
- 1<sup>st</sup> Quarterly 2019 Report