a UNESCAP Intergovermental Organization
a UNESCAP Intergovermental Organization
Quarterly Publication
1st Quarterly 2021 Report
Contents
| Executive Summary | 3 |
| Quarter 1 Trade statistics | 4 |
| Demand & Supply | 5 |
| Current Price Update and Q1 trends | 6 |
Executive Summary
Black Pepper harvest started in most origins in the Northern hemisphere. Vietnam, India, and Sri Lanka have completed close to 80% of the harvest. Prices that were expected to soften during harvest went up by close to 40% leading to delays and defaults at the farmgate.
Vietnam Black pepper markets have become very volatile making it difficult for processors, industrial manufacturers, and growers. Growers in one origin hold stocks thinking markets would keep rising but they sometimes indirectly benefit other origins. After Vietnamese Tet black pepper prices rose from USD 3,000 per Mt to USD 4,200 per Mt, approximately 40%. The volume traded was very small in Vietnam. Markets are now back to USD 3,600 per Mt.
It is indeed good for growers of Vietnam that prices rise, and this allows them to make pepper farming sustainable. However, a step-by-step approach is healthier as it gives the market the time to readjust. Likewise, sudden drop in prices is also not good as it disturbs the growers as their incomes fall. Vietnam pepper is low priced due to this sudden change as buyers consider it a very risky venture. Pepper from India, Malaysia, Sri Lanka are less volatile as they have based their production on differentiation in terms of quality and not just mere volume.
The key task of the various agencies here is to provide more information to growers on demand and supply so that they can plan better and allow the markets to rise slowly or vice versa. The industry participants should therefore get together and jointly work to support each other as they all are interdependent. The growers equally need collectors and exporters as do the exporters need them. We expect Vietnam pepper markets, which are right now sentiment driven, to cool off very soon as buyers decide to wait or even to switch to other spices in the long term.
Quarter 1 Trade statistics
Q1 Jan to March 2021
Globally Pepper shipments fell slightly due to delays at farmgate as prices rose sharply.
| Origin | Exports | Imports | YOY comparison |
|---|---|---|---|
| Vietnam | 61 | 8 | 80 KMT Down 25% |
| Brazil | 25 | 0 | Last year 24 KMT |
Vietnam:
The carry over stock in Vietnam was reported lower and crop estimations were close to 220,000 Mt.
Thus, in Q1 if one considers YOY the shipments are close to 25% of the annual availability.
Brazil:
The shipments from Brazil are at par with the last year and there is no significant change there. A lot of demand from middle east got converted from Vietnam to Brazil due to the arbitrage.
Demand & Supply
Supply Situation:
Vietnam: Crop is expected 10% lower. Harvest is about 80% completed. Early rains this year are a deterrent to drying.
Cambodia: Harvest has started and may continue till mid-May.
India: Harvest is over.
Sri Lanka: Harvest is under way.
Brazil short crop: Harvest underway.
Demand Situation:
China: Buying continuously.
India Domestic: Lock downs create supply disruptions.
Europe: Partially covered and waiting for better prices.
USA: Covered till June and looking for forward offers.
Middle East and Islamic World: Quiet and have entered in the holy Ramadan period.
Current Price Update and Q1 trends
Vietnam
Brazil
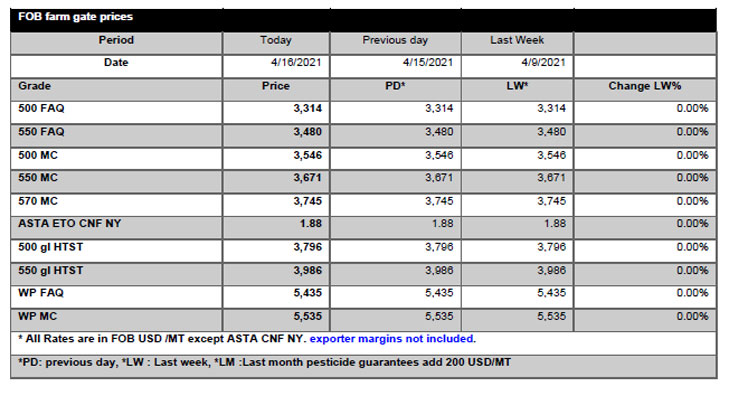
ASTA Fob: USD 3,850 per Mt
B1 Fob: USD 3,800 per Mt
Indonesia
L ASTA fob: USD 4,000 per Mt
Muntok White: USD 6,500 per Mt
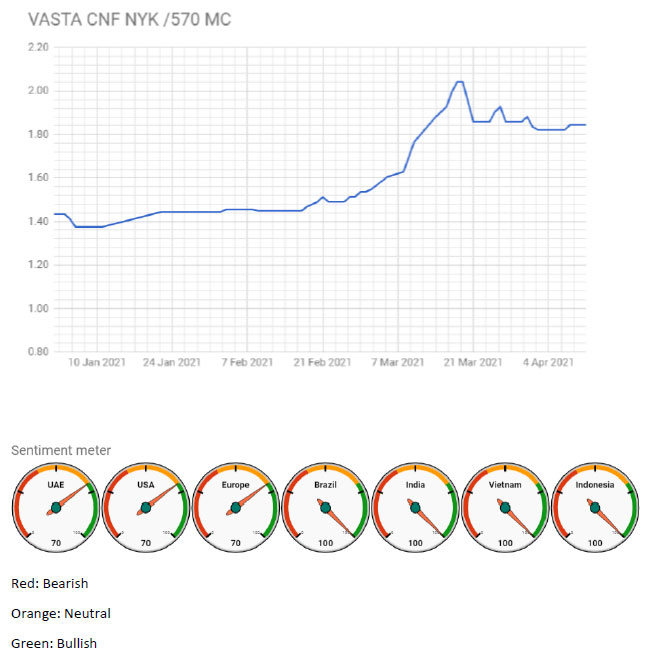
Vietnam ASTA 570 g/l CNF New York rose from USD 1.40 per lb. in Jan to USD 2.00 per lb. in March and now seem to have settled at USD 1.85 per lb. Current Global pepper prices are basically 40% higher when compared to the opening price in 2021.
Freight index from Asia to EU and US
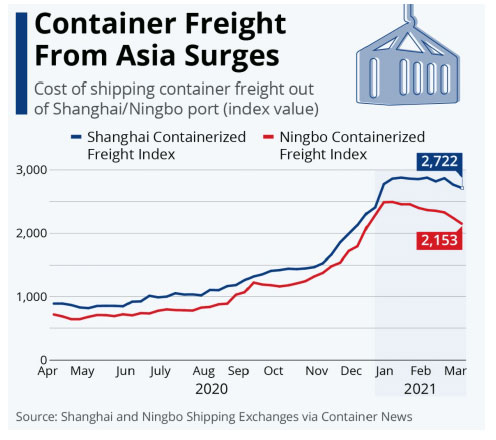
From Aug 2020 freights started to rise in the aftermath of Covid-19. The rates were expected to lower in March and they reduced marginally but again in April they have surged and scaled new heights.
Freights from Vietnam/Indonesia to EU main ports: USD 4,000 /20ft and USD 8,000/ 40ft.
Freights from Vietnam/Indonesia to US main ports: USD 6,000 /20ft and USD 11,000/ 40ft.
Freights to EU have risen from USD 80 per Mt to USD 300 per Mt.
Freights to US have risen from USD 150 per Mt to USD 400 per Mt.
Previous Publications
- GLOBAL PEPPER MARKET REPORT ANNUAL REVIEW 2025 AND OUTLOOK 2026
- Global Pepper Report - First Half January to June FY 2025
- GLOBAL PEPPER INDUSTRY SEMESTERLY REPORT
- GLOBAL PEPPER INDUSTRY 3RD QUARTERLY REPORT (JULY - OCTOBER 2022)
- WORLD PEPPER INDUSTRY 2ND QUARTERLY REPORT (JAN -JUNE 2022)
- 1st Quarterly 2022 Report
- 3rd Quarterly 2021 Report
- 2nd Quarterly 2021 Report
- 1st Quarterly 2021 Report
- 4th Quarterly 2020 Report
- 3rd Quarterly 2020 Report
- 2nd Quarterly 2020 Report
- 1st Quarterly 2020 Report
- 4th Quarterly 2019 Report
- 3rd Quarterly 2019 Report
- 2<sup>nd</sup> Quarterly 2019 Report
- 1<sup>st</sup> Quarterly 2019 Report